

Sensitivity, robustness, and identifiability in stochastic chemical kinetics models
- PMID: 21551095
- PMCID: PMC3102369
- DOI: 10.1073/pnas.1015814108
Sensitivity, robustness, and identifiability in stochastic chemical kinetics models
Abstract
We present a novel and simple method to numerically calculate Fisher information matrices for stochastic chemical kinetics models. The linear noise approximation is used to derive model equations and a likelihood function that leads to an efficient computational algorithm. Our approach reduces the problem of calculating the Fisher information matrix to solving a set of ordinary differential equations. This is the first method to compute Fisher information for stochastic chemical kinetics models without the need for Monte Carlo simulations. This methodology is then used to study sensitivity, robustness, and parameter identifiability in stochastic chemical kinetics models. We show that significant differences exist between stochastic and deterministic models as well as between stochastic models with time-series and time-point measurements. We demonstrate that these discrepancies arise from the variability in molecule numbers, correlations between species, and temporal correlations and show how this approach can be used in the analysis and design of experiments probing stochastic processes at the cellular level. The algorithm has been implemented as a Matlab package and is available from the authors upon request.
Conflict of interest statement
The authors declare no conflict of interest.
Figures
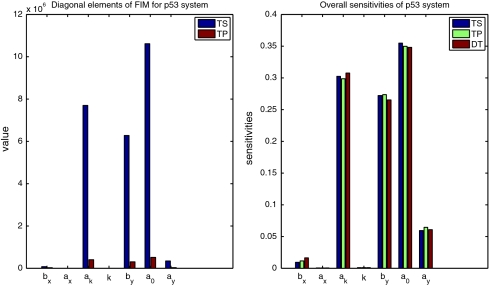
 for TS, TP, DT version of p53 model. FIMs were calculated for parameters presented in
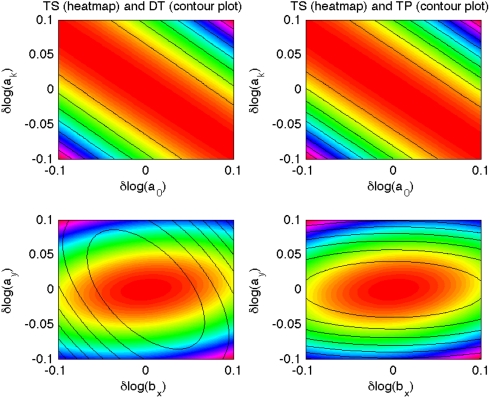
References
-
- Csete ME, Doyle JC. Reverse engineering of biological complexity. Science. 2002;295:1664–1669. - PubMed
-
- Varma A, Morbidelli M, Wu H. Parametric Sensitivity in Chemical Systems. Cambridge, UK: Cambridge University Press; 1999.
-
- Maheshri N, O’Shea EK. Living with noisy genes: How cells function reliably with inherent variability in gene expression. Annu Rev Bioph Biom. 2007;36:413–434. - PubMed
-
- Elowitz MB, Levine AJ, Siggia ED, Swain PS. Stochastic gene expression in a single cell. Science. 2002;297:1183–1186. - PubMed
Publication types
MeSH terms
Grants and funding
- BB/C519670/1/BB_/Biotechnology and Biological Sciences Research Council/United Kingdom
- BB/F005237/1/BB_/Biotechnology and Biological Sciences Research Council/United Kingdom
- BB/G020434/1/BB_/Biotechnology and Biological Sciences Research Council/United Kingdom
- BB/F005261/1/BB_/Biotechnology and Biological Sciences Research Council/United Kingdom
LinkOut - more resources
Full Text Sources
