. 2011 Aug;39(15):6428-39.
doi: 10.1093/nar/gkr236. Epub 2011 May 6.

msl2 mRNA is bound by free nuclear MSL complex in Drosophila melanogaster

Affiliations

msl2 mRNA is bound by free nuclear MSL complex in Drosophila melanogaster

Anna-Mia Johansson et al. Nucleic Acids Res. 2011 Aug.

Abstract

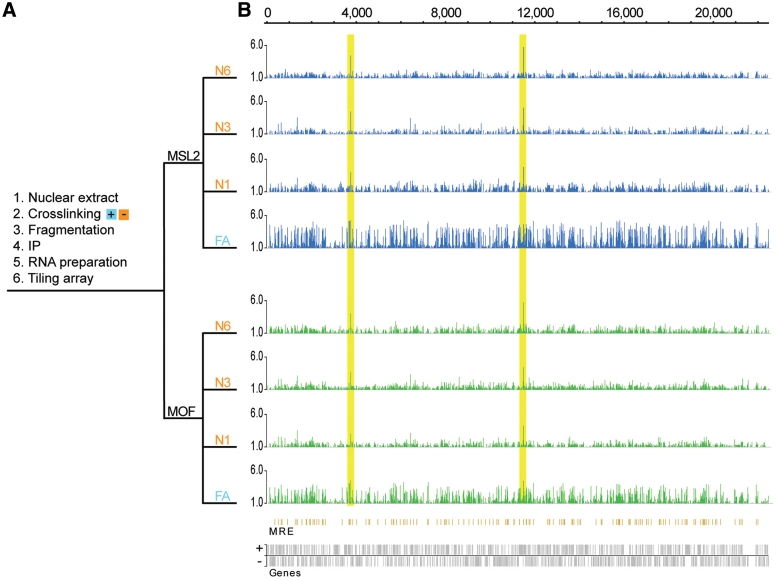
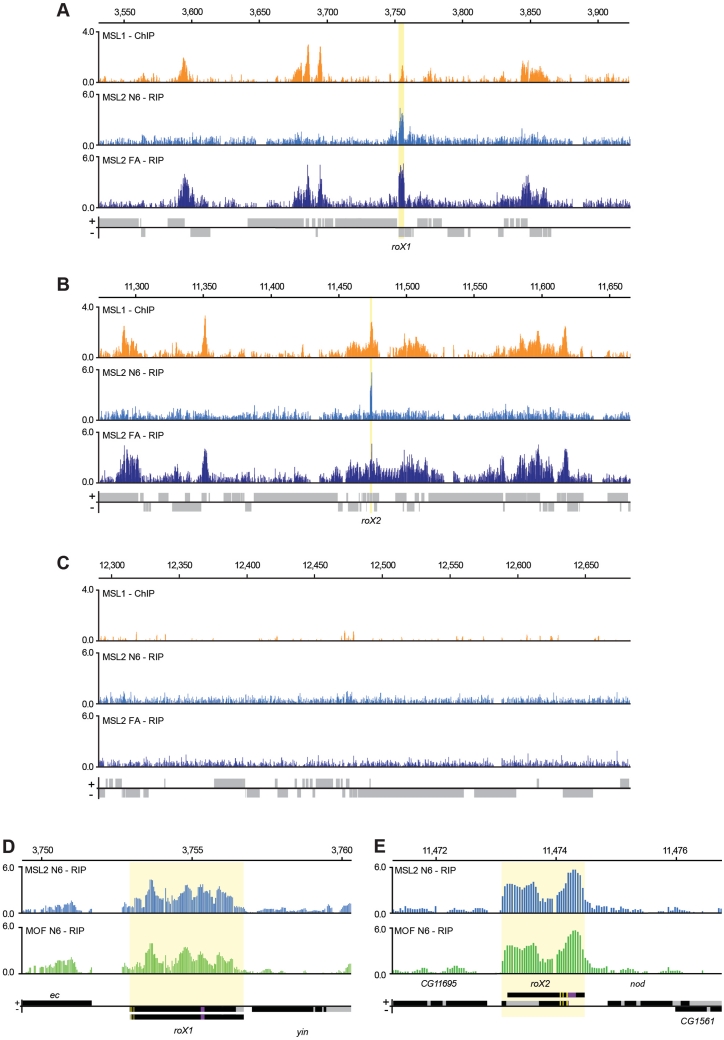
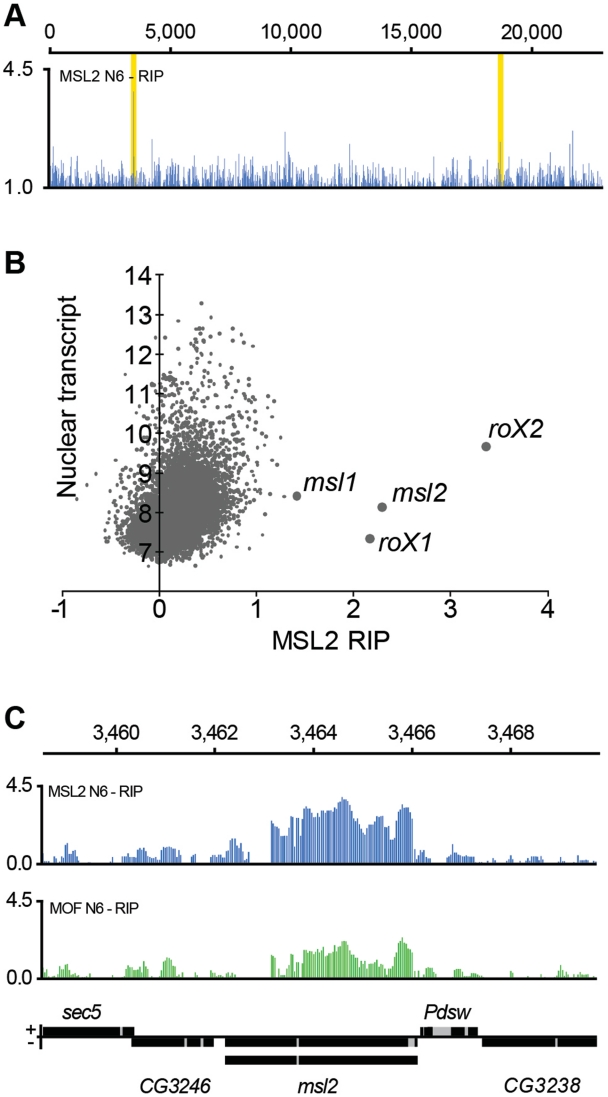
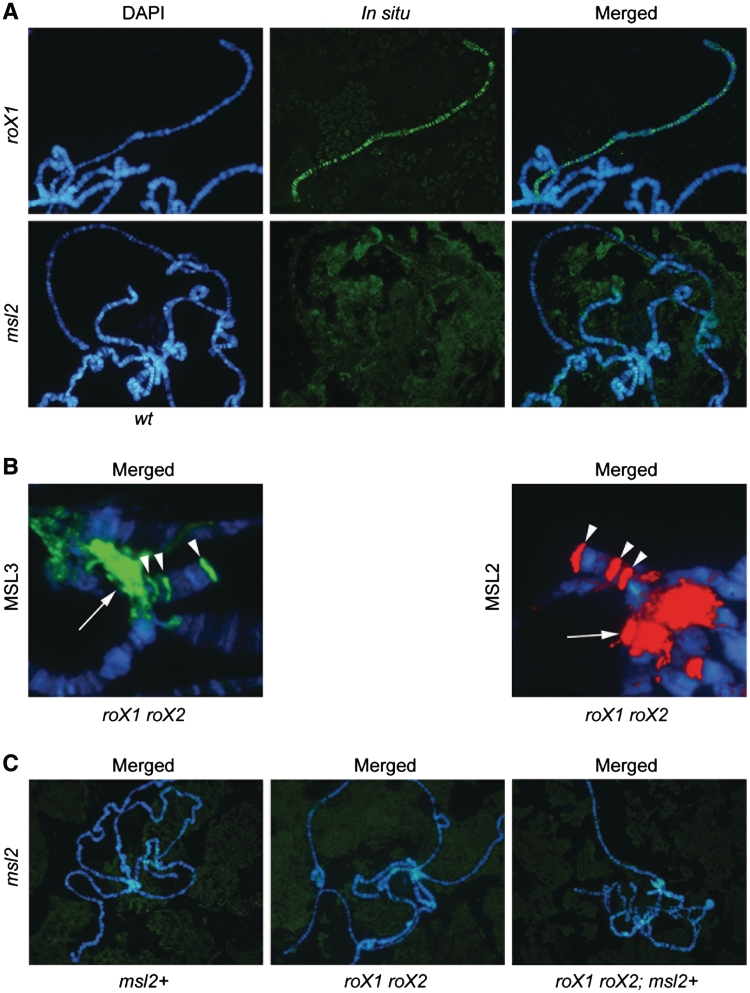
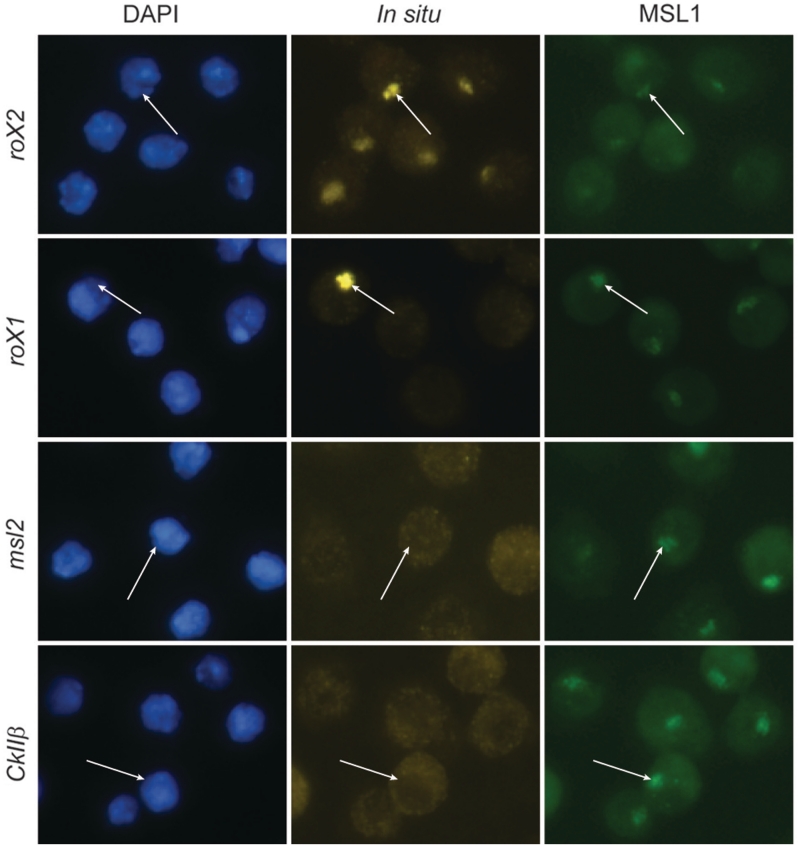
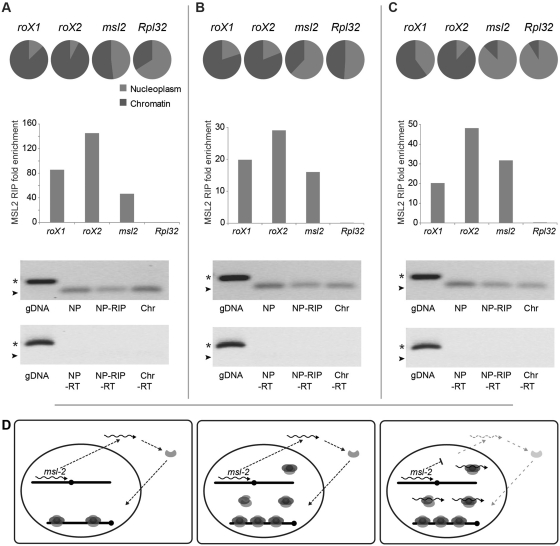
In Drosophila, the global increase in transcription from the male X chromosome to compensate for its monosomy is mediated by the male-specific lethal (MSL) complex consisting of five proteins and two non-coding RNAs, roX1 and roX2. After an initial sequence-dependent recognition by the MSL complex of 150-300 high affinity sites, the spread to the majority of the X-linked genes depends on local MSL-complex concentration and active transcription. We have explored whether any additional RNA species are associated with the MSL complex. No additional roX RNA species were found, but a strong association was found between a spliced and poly-adenylated msl2 RNA and the MSL complex. Based on our results, we propose a model in which a non-chromatin-associated partial or complete MSL-complex titrates newly transcribed msl2 mRNA and thus regulates the amount of available MSL complex by feedback. This represents a novel mechanism in chromatin structure regulation.


Figures

Figure 1.
Figure 1.
MSL-complex associates with roX1 and roX2 RNAs transcribed from the X chromosome. (A) Schematic outline of the RIP method. N1, N3 and N6 correspond to native nuclear extracts sonicated for 1, 3 and 6 min, respectively. FA corresponds to formaldehyde-cross-linked nuclear extract. (B) The tiling array results are computed as the ratio between the RIP value and the value of the corresponding nuclear input RNA preparation; MSL2-RIPs (blue), MOF-RIPs (green). Ratios calculated between the RIP values and a MOCK-RIP (instead of input) yield comparable results (data not shown). The plots show the mean enrichment ratios obtained using a bandwidth of 90 bp. Numbers on the x-axis denote chromosomal position along the X chromosome in kilobase. The y-axis shows the RIP enrichment as the log2-ratio. In the resulting profile, enrichments >1 (which correspond approximately to the top 1% of binding) are shown. Genes expressed from left to right are shown above the horizontal line and genes expressed in the opposite direction are shown below the line. The high peaks within the yellow boxes are roX1 and roX2, respectively. Below the enrichment plots, the MRE sites are indicated (orange) as previously characterized by (13). No significant correlation of immunoprecipitated RNAs to MREs was found.
Figure 2.
Figure 2.
Entire roX1 and roX2 mRNAs are associated with a complete or partial MSL complex. (A–C) In formaldehyde cross-linked extracts, actively transcribed RNAs are immunoprecipitated by chromatin-associated proteins. Comparison of a ChIP-chip profile representing the MSL complex (MSL1-ChIP) and the MSL2 RIP-chip profiles from the native nuclear extract (MSL2 N6-RIP) and formaldehyde-cross-linked nuclear extract (MSL2 FA-RIP). Representative 400 kb regions from the X chromosome including roX1 (A) and roX2 (B) are compared to a representative 400 kb region from chromosome 3 R (C). The plots show the mean enrichment ratios obtained using a bandwidth of 300 bp for the MSL1 ChIP-chip and a bandwidth of 90 bp for the MSL2 RIP-chip. Numbers on the x-axis denote chromosomal position along the chromosome in kb. The y-axis shows the ChIP and RIP enrichments, respectively, as the log2 ratio. Genes expressed from left to right are shown above the horizontal line and genes expressed in the opposite direction are shown below the line. The roX1 and roX2 loci are indicated by yellow boxes. The MSL1 ChIP data is from (32). (D and E) High resolution enrichment profiles of MSL2-RIP and MOF-RIP at the rox1 (D) or roX2 (E) locus. Exons are indicated in black and introns in grey. The different transcript forms of roX1 and roX2 are indicated. The described DNAse hypersensitive regions and roX-boxes suggested to be of functional importance (36,51–53) are indicated as deep-purple and yellow boxes, respectively. We observed a general enrichment of the entire mRNA and no obvious specificity to parts of the RNAs.
Figure 3.
Figure 3.
MSL complex is strongly associated with nuclear msl2 mRNA. (A) High resolution enrichment profiling along chromosome 2 L shows that msl2 is enriched in the MSL2-RIP at similar ratios to roX1 and roX2. The high peaks within the yellow boxes correspond to msl2 (left box) and msl1 (right box). (B) Average calculated enrichment levels of genes (x-axis) plotted against the average amount of nuclear transcript (y-axis, log2 scale) for all genes with at least 10 probes within exons. roX1, roX2 and msl2 clearly ordinate as highly enriched. Note that the absolute amount of msl2 RNA pulled down is similar to the absolute amounts of the roX RNAs. (C) The entire msl2 mRNA is associated with a complete or partial MSL complex. High resolution enrichment profiles of MSL2-RIP (blue) and MOF-RIP (green) at the msl2 locus. The msl2 gene is transcribed from right to left and the different splice forms are indicated. Numbers on the x-axis denote chromosomal position along the X chromosome in kilobase. The y-axis shows the RIP enrichment as the log2 ratio.
Figure 4.
Figure 4.
In polytene chromosomes, msl2 RNA is not associated with the chromatin bound MSL complex. (A) In situ hybridization shows that roX1 decorates the male X chromosome (top row of images). No msl2 RNA associated with the wild-type male X chromosome is detected (bottom row of images). (B) In roX1 roX2 mutant males MSL2 and MSL3 target the chromocenter and three specific sites on the fourth chromosome. Merged images of immunostainings showing DAPI in blue, MSL3 in green and MSL2 in red. The chromocenter is indicated by an arrow and the specific sites on the fourth chromosome with arrowheads (Supplementary Figure S6). (C) Merged images from in situ hybridization with msl2 RNA antisense probe on males overexpressing msl2 (left panel), roX1 roX2 mutant males (middle) and roX1 roX2 mutant males overexpressing msl2 (right) (Supplementary Figure S8).
Figure 5.
Figure 5.
In S2 cells, msl2 RNA is not associated with the chromatin bound MSL complex. Immunostaining and in situ hybridization show that roX2 (yellow) decorates the X chromosome identified by MSL1 (green). Note that roX1 decorates the X chromosome in a small fraction of cells (<0.5%). Nuclei are visualized with DAPI. Neither the msl2 RNA nor the negative control CkIIβ RNA are enriched on the X chromosome. In each row, the location of one X chromosome in a representative cell is indicated with an arrow.
Figure 6.
Figure 6.
Spliced and poly-adenylated msl2 RNA is associated to a non-chromatin bound MSL complex. (A–C) Fractionation and RIP experiments of three biological replicates using total RNA extraction (A and B) and extracted poly(A)+ RNA (C). The circle diagrams specify the relative proportion of the RNAs in the nucleoplasm (gray) and the chromatin fractions (dark gray). The majority of the roX1 and roX2 RNAs are located in the chromatin fraction while msl2 and the negative control Rpl32 are mainly found within the nucleoplasm. As illustrated in the histograms, enrichment of msl2 RNA in the MSL complex is confirmed by RIP experiments on the nucleoplasmic fractions using MSL2 antibodies. Displayed are the fold enrichments relative to actin RNA. Immunoprecipitated msl2 in experiments A, B and C correspond to 3, 4 and 10% of input, respectively. Gel-electrophoretic analyses of amplified genomic DNA (gDNA), immunoprecipitated (NP RIP) and total RNA from the nucleoplasm (NP) and from chromatin (Chr) fractions show that msl2 RNAs associated to the MSL complex are spliced. The PCR product sizes of the spliced msl2 amplicon and the unspliced amplicon are indicated by arrowheads and stars, respectively. The minus reverse transcriptase controls (-RT) are shown below. (D) Model for feedback regulation of MSL complex via the association of a non-chromatin MSL complex with the msl2 mRNA. When free nuclear MSL complex is present this non-chromatin MSL-complex titrates msl2 RNA and thus reduces the amount of msl2 transcript available for export and translation, which in turn regulates the complex production as a feedback mechanism.

Similar articles

Cited by

References

    1. Gelbart ME, Kuroda MI. Drosophila dosage compensation: a complex voyage to the X chromosome. Development. 2009;136:1399–1410. - PMC - PubMed
    1. Larsson J, Meller VH. Dosage compensation, the origin and the afterlife of sex chromosomes. Chromosome Res. 2006;14:417–431. - PubMed
    1. Gupta V, Parisi M, Sturgill D, Nuttall R, Doctolero M, Dudko OK, Malley JD, Eastman PS, Oliver B. Global analysis of X-chromosome dosage compensation. J. Biol. 2006;5:3. - PMC - PubMed
    1. Nguyen DK, Disteche CM. Dosage compensation of the active X chromosome in mammals. Nat. Genet. 2006;38:47–53. - PubMed
    1. Zhang Y, Oliver B. Dosage compensation goes global. Curr. Opin. Genet. Dev. 2007;17:113–120. - PubMed

Publication types

MeSH terms

Associated data