

Prognostic significance of additional cytogenetic aberrations in 733 de novo pediatric 11q23/MLL-rearranged AML patients: results of an international study
- PMID: 21551233
- PMCID: PMC3143552
- DOI: 10.1182/blood-2010-12-328302
Prognostic significance of additional cytogenetic aberrations in 733 de novo pediatric 11q23/MLL-rearranged AML patients: results of an international study
Abstract
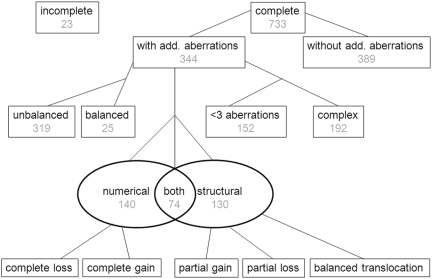
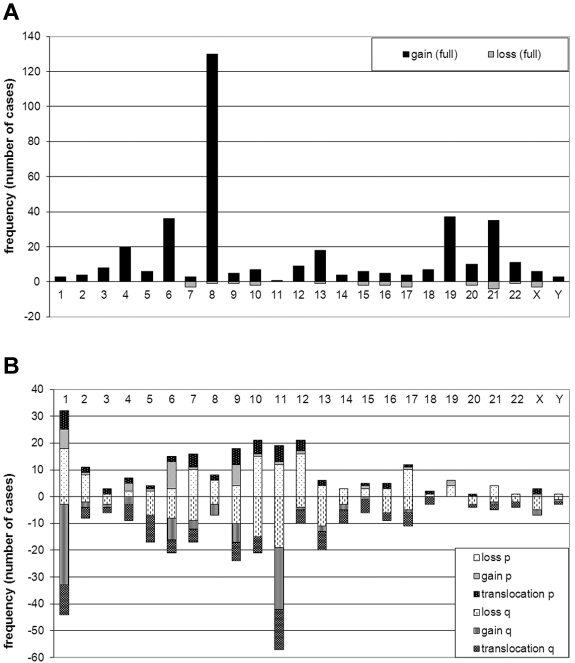
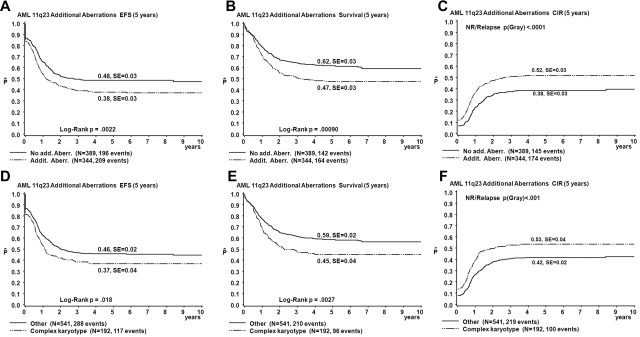
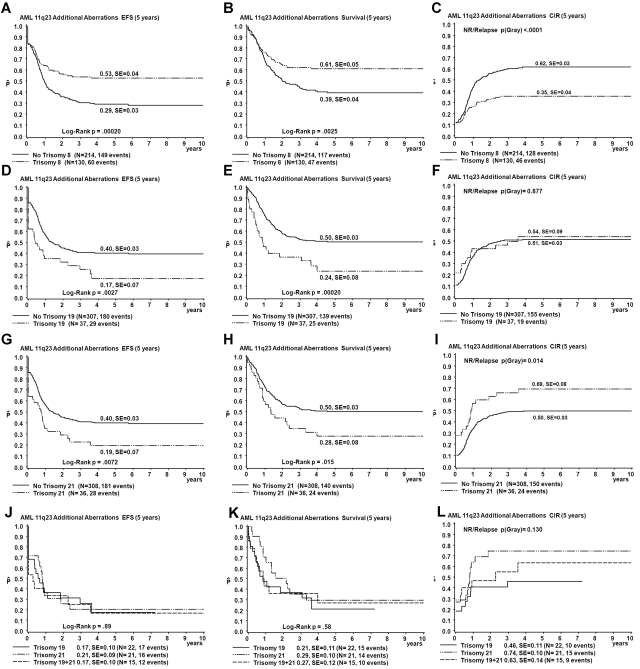
We previously demonstrated that outcome of pediatric 11q23/MLL-rearranged AML depends on the translocation partner (TP). In this multicenter international study on 733 children with 11q23/MLL-rearranged AML, we further analyzed which additional cytogenetic aberrations (ACA) had prognostic significance. ACAs occurred in 344 (47%) of 733 and were associated with unfavorable outcome (5-year overall survival [OS] 47% vs 62%, P < .001). Trisomy 8, the most frequent specific ACA (n = 130/344, 38%), independently predicted favorable outcome within the ACAs group (OS 61% vs 39%, P = .003; Cox model for OS hazard ratio (HR) 0.54, P = .03), on the basis of reduced relapse rate (26% vs 49%, P < .001). Trisomy 19 (n = 37/344, 11%) independently predicted poor prognosis in ACAs cases, which was partly caused by refractory disease (remission rate 74% vs 89%, P = .04; OS 24% vs 50%, P < .001; HR 1.77, P = .01). Structural ACAs had independent adverse prognostic value for event-free survival (HR 1.36, P = .01). Complex karyotype, defined as ≥ 3 abnormalities, was present in 26% (n = 192/733) and showed worse outcome than those without complex karyotype (OS 45% vs 59%, P = .003) in univariate analysis only. In conclusion, like TP, specific ACAs have independent prognostic significance in pediatric 11q23/MLL-rearranged AML, and the mechanism underlying these prognostic differences should be studied.
Figures
References
-
- Balgobind BV, Zwaan CM, Reinhardt D, et al. High BRE expression in pediatric MLL-rearranged AML is associated with favorable outcome. Leukemia. 2010;24(12):2048–2055. - PubMed
-
- Harrison CJ, Hills RK, Moorman AV, et al. Cytogenetics of childhood acute myeloid leukemia: United Kingdom Medical Research Council Treatment trials AML 10 and 12. J Clin Oncol. 2010;28(16):2674–2681. - PubMed
-
- Hollink IH, van den Heuvel-Eibrink MM, Zimmermann M, et al. Clinical relevance of Wilms tumor 1 gene mutations in childhood acute myeloid leukemia. Blood. 2009;113(23):5951–5960. - PubMed
-
- Hollink IH, Zwaan CM, Zimmermann M, et al. Favorable prognostic impact of NPM1 gene mutations in childhood acute myeloid leukemia, with emphasis on cytogenetically normal AML. Leukemia. 2009;23(2):262–270. - PubMed
-
- Kuipers JE, Coenen EA, Balgobind BV, et al. High IGSF4 expression in pediatric M5 acute myeloid leukemia with t(9;11)(p22;q23). Blood. 2011;117(3):928–935. - PubMed
Publication types
MeSH terms
Substances
Supplementary concepts
Grants and funding
LinkOut - more resources
Full Text Sources
Medical
