. 2011 Jul 1;71(13):4675-85.
doi: 10.1158/0008-5472.CAN-10-4558. Epub 2011 May 6.

Perinatal or adult Nf1 inactivation using tamoxifen-inducible PlpCre each cause neurofibroma formation

Affiliations

Perinatal or adult Nf1 inactivation using tamoxifen-inducible PlpCre each cause neurofibroma formation

Debra A Mayes et al. Cancer Res. .

Abstract

Plexiform neurofibromas are peripheral nerve sheath tumors initiated by biallelic mutation of the NF1 tumor suppressor gene in the Schwann cell lineage. To understand whether neurofibroma formation is possible after birth, we induced Nf1 loss of function with an inducible proteolipid protein Cre allele. Perinatal loss of Nf1 resulted in the development of small plexiform neurofibromas late in life, whereas loss in adulthood caused large plexiform neurofibromas and morbidity beginning 4 months after onset of Nf1 loss. A conditional EGFP reporter allele identified cells showing recombination, including peripheral ganglia satellite cells, peripheral nerve S100β+ myelinating Schwann cells, and peripheral nerve p75+ cells. Neurofibromas contained cells with Remak bundle disruption but no recombination within GFAP+ nonmyelinating Schwann cells. Extramedullary lympho-hematopoietic expansion was also observed in PlpCre;Nf1fl/fl mice. These tumors contained EGFP+/Sca-1+ stromal cells among EGFP-negative lympho-hematopoietic cells indicating a noncell autonomous effect and unveiling a role of Nf1-deleted microenvironment on lympho-hematopoietic proliferation in vivo. Together these findings define a tumor suppressor role for Nf1 in the adult and narrow the range of potential neurofibroma-initiating cell populations.


Figures

Figure 1
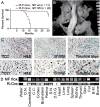
Figure 1. Perinatal loss of Nf1 mice causes two phases of mortality and late neurofibroma formation
(A) Kaplan-Meyer survival curve (p < 0.0001). (B) Gross dissection of cervical spinal cord with DRG-associated small GEM Grade I neurofibromas at each dorsal root in a PlpCre+;Nf1fl/fl animal at 18 months of age. Ruler shows 1mm markings. (C) Tissue sections of GEM Grade I neurofibroma in PlpCre+;Nf1fl/fl animal after perinatal tamoxifen. Upper panels are magnified 10×; lower panels 25×. Red arrows highlight mast cells.
Figure 2
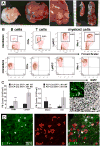
Figure 2. Perinatal Nf1 loss causes reactive hyperplasia of hematopoietic cells
(A) Left, wild type liver; Middle, Nf1fl/fl enlarged liver with white masses; Right, enlarged Nf1fl/fl spleen with white masses (right) compared to a wildtype spleen (left). Rulers show 1mm markings. (B) Flow cytometric analysis of splenocytes from PLP-Cre ERT+;Nf1fl/fl;EGFP+ mice, analyzed for content of B (CD45R/B220), T (CD3e) and myeloid cells (Ly6G/C and Mac-1). All were EGFP-. (C). Peripheral blood counts from total CBC and Blood Smear Counts show increased PMN (** p = 0.0026) and lymphocytes (LY; *** p = 0.0006), and decreased monocytes (MO; * p = 0.0347) of PLP-CreERT+;Nf1fl/fl animals compared to age-matched litermate controls but not eosiniphils (EO). (C, right panel) H&E stain and EGFP+ (insert) cells within a liver mass. Insert and H&E are at the same magnification (40×). (D) Double labeled Sca1+ (red) and EGFP+ (green) cells (40×). Round cells of possible lympho-hematopoietic lineage are EGFP negative.
Figure 3
Figure 3. Adult Tamoxifen exposure in PlpCre;Nf1fl/fl mice causes neurofibroma formation
(A) Kaplan-Meyer survival curve (p < 0.0001). (B) Gross dissection of cervical spinal cord with GEM Grade I neurofibromas in a PlpCre+;Nf1fl/fl animal. Ruler shows 1mm markings. (C) Tissue sections of a GEM Grade I neurofibroma in a PlpCre+;Nf1fl/fl animal after adult tamoxifen. Upper panels are magnified 10×; lower panels are magnified 25×. Red arrows highlight mast cells. (D) PCR analysis shows the Nf1 floxed allele (NF flox) and the recombined Cre allele (R-Cre). Each lane contains 1ug of DNA. (O.N. = optic nerve; C.C. = corpus callosum; S.N. = sciatic nerve; DRG = dorsal root ganglia; B.M. = bone marrow).
Figure 4
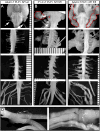
Figure 4. Neurofibroma formation is predominant within the peripheral nerves and DRGs at cervical spinal levels
Gross micrographs show age-matched 12 month old (A) PlpCre;WT, (B) P1-3 tamoxifen-injected PlpCre;Nf1fl/fl, and (C) adult tamoxifen-injected PlpCre;Nf1fl/fl animals. Brainstem (top row), cervical (second row), thoracic (third row), and lumbar/sacral (forth row) spinal cord. Ruler shows 1mm markings. Arrows (A & B) = cranial nerves emerging from the brainstem. Red lines (B & C) = facial neurofibromas developed from cranial nerves. Red asterisk (* in B) = compression of the brainstem resulting from cranial nerve neurofibroma (pulled away with forceps to show compression). In cervical neurofibroma images (B & C; second row) forceps slightly pulled the nerves from the spinal cord to visualize tumors. Adult tamoxifen-injected PlpCre;WT and PlpCre;Nf1fl/fl peripheral nerves of the cauda equine are shown enlarged in D.
Figure 5
Figure 5. Disrupted Remak bundles in PlpCre;Nf1fl/fl nerves
Electron micrographs of the saphenous nerves of 12 month old (A) PlpCre+;WT control, (B) P1-3 tamoxifen-injected PlpCre+;Nf1fl/fl, and (C) adult tamoxifen-injected PlpCre+;Nf1fl/fl animals. Large Arrows in B & C highlight Remak bundle disruption; arrowheads highlight myelin sheaths in B & C. 4,000× = upper panels. 40,000× = lower panels. Schwann cell cytoplasmic processes are identified by their continuous basal lamina (small arrows lower panels).
Figure 6
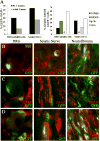
Figure 6. EGFP+ cells after tamoxifen injection in PlpCre+ animals
(A) Graph (left) indicates percentages of EGFP+/DAPI+ cells in sciatic nerve and DRG/satellite cells and (right) the percent of EGFP+ recombined cells that double labeled with S100β, GFAP, p75, or GS. (B) Double immunolabeling (40×) shows EGFP+/S100β+ cells within the DRG or Sciatic Nerve one day post Tamoxifen. (C) EGFP+/GFAP+ cells are present in the DRG but not Sciatic Nerve. (D) EGFP+/p75+ cells are absent in the DRG and present in Sciatic Nerve. Immunohistochemistry in neurofibromas after adult tamoxifen exposure within the PlpCre;Nf1fl/fl model shows EGFP double labeling with S100β+ (B), p75 (D) but not GFAP+ (C).
Figure 7
Figure 7. EGFP+ cells proliferate in PlpCre+ animals
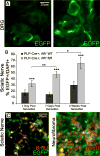
EGFP+ cells (green; 40×) within the DRG one day post last Tamoxifen injection (A, left) and 15 months post Tamoxifen (A, right) in PlpCre;Nf1fl/fl animals. (B) Quantification of the EGFP+ population in sciatic nerves of PlpCre;Nf1fl/fl and littermate wild type animals (n = 3-5 per time point per genotype). The total % EGFP+/DAPI+ cells were calculated after times after tamoxifen injection. BrdU immunostaining (40×) co-localizes in EGFP+ cells at 4 weeks post Tamoxifen injection (C, left) and within a neurofibroma (C, right). * p < 0.01; ** p < 0.001; *** p < 0.00001.

Similar articles

Cited by

References

    1. Friedman JM. Epidemiology of neurofibromatosis type 1. Am J Med Genet. 1999;891:1–6. - PubMed
    1. Boyd KP, Korf BR, Theos A. Neurofibromatosis type 1. J Am Acad Dermatol. 2009;611:1–14. - PMC - PubMed
    1. Rosenfeld A, Listernick R, Charrow J, Goldman S. Neurofibromatosis type 1 and high-grade tumors of the central nervous system. Childs Nerv Syst. 2010;265:663–7. - PubMed
    1. Emanuel PD, Bates LJ, Castleberry RP, et al. Selective hypersensitivity to granulocyte-macrophage colony-stimulating factor by juvenile chronic myeloid leukemia hematopoietic progenitors. Blood. 1991;77:925–929. - PubMed
    1. Niemeyer CM, Arico M, Basso G, et al. Quantitative effects of Nf1 inactivation on in vivo hematopoiesis. Blood. 1997;89:3534. - PubMed

Publication types