. 2011 Oct;28(10):2799-810.
doi: 10.1093/molbev/msr109. Epub 2011 May 6.

Gene loss and parallel evolution contribute to species difference in flower color

Affiliations

Gene loss and parallel evolution contribute to species difference in flower color

Stacey D Smith et al. Mol Biol Evol. 2011 Oct.

Abstract

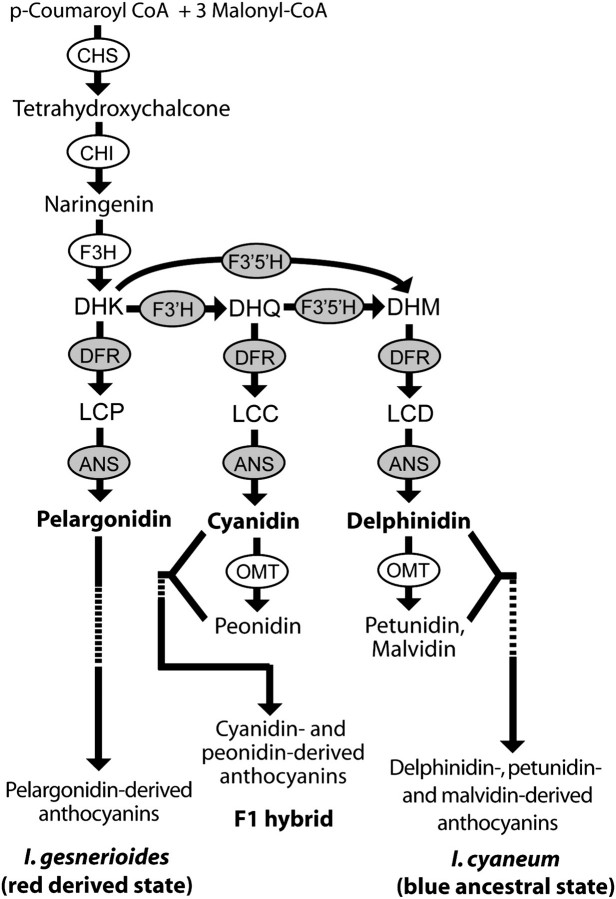
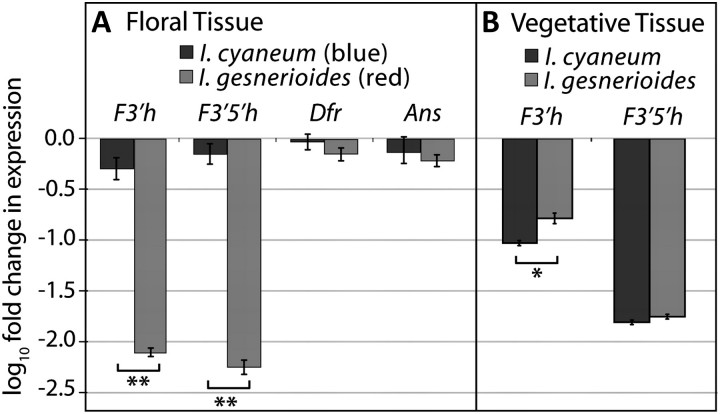
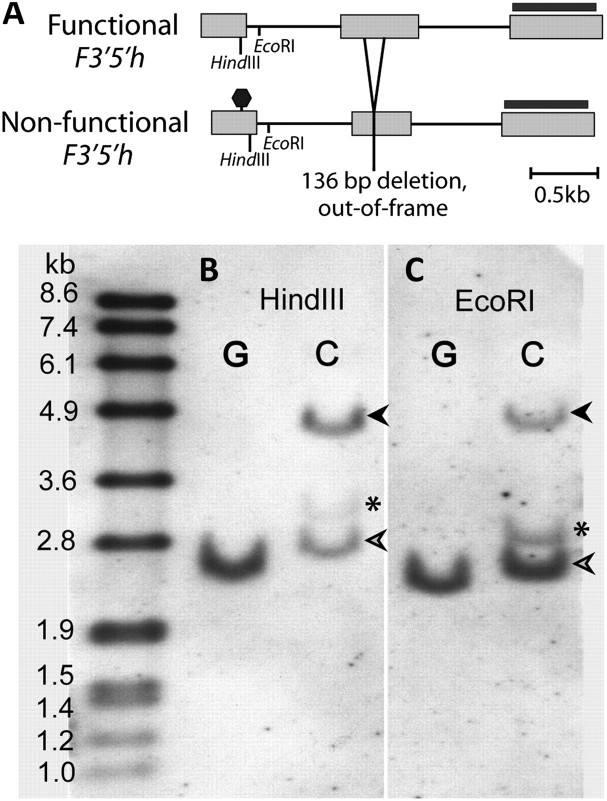
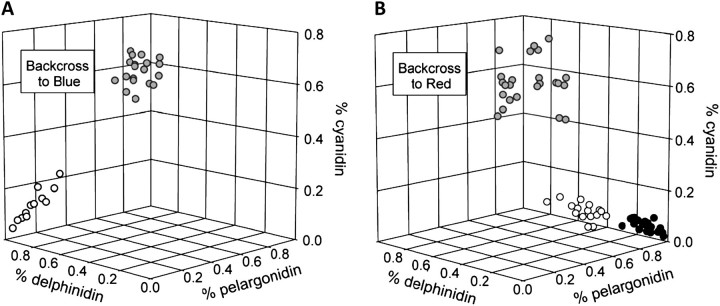
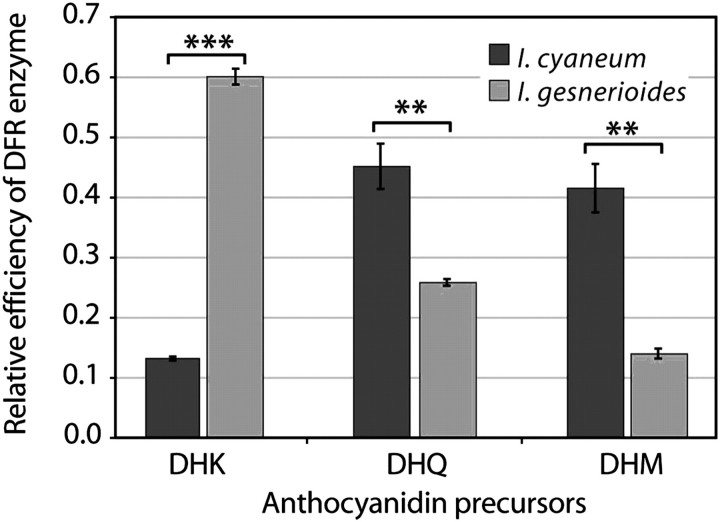
Although the importance of regulatory and functional sequence evolution in generating species differences has been studied to some extent, much less is known about the role of other types of genomic changes, such as fluctuation in gene copy number. Here, we apply analyses of gene function and expression of anthocyanin pigment pathway genes, as well as cosegregation analyses in backcross populations, to examine the genetic changes involved in the shift from blue to red flowers in Andean Iochroma (Solanaceae). We demonstrate that deletion of a gene coding for an anthocyanin pathway enzyme was necessary for the transition to red floral pigmentation. The downregulation of a second pathway gene was also necessary for the novel flower color, and this regulatory pattern parallels the genetic change in the two other red-flowered species in the sister family Convolvulaceae in which flower color change has been examined genetically. Finally, we document a shift in enzymatic function at a third locus, but the importance of this change in the transition to red flowers depends on the exact order with which the three changes occurred. This study shows that gene inactivation or loss can be involved in the origin of phenotypic differences between species, thereby restricting the possibility of reversion to the ancestral state. It also demonstrates that parallel evolution of red flowers in three different species occurs via a common developmental/regulatory change but by mutations in different genes.


Figures

F<sc>IG</sc>. 1.
FIG. 1.
Anthocyanin biosynthesis pathway and production in the parental species, Iochroma gesnerioides and Iochroma cyaneum and the F1 hybrid. Pathway enzymes (circled) include flavanone 3-hydroxylase (F3H), flavonoid 3′-hydroxylase (F3′H), flavonoid 3′,5′-hydroxylase (F3′5′H), DFR, anthocyanidin synthase (ANS), and O-methyltransferase (OMT) (Holton and Cornish 1995). Anthocyanin precursors include DHK, DHQ, and DHM. The pathway produces three classes of anthocyanidins: 1) those derived from pelargonidin; 2) those derived from cyanidin (includes peonidin), and 3) those derived from delphinidin (includes petunidin and malvidin). Anthocyanidins are modified by the addition of sugars and other moieties to form anthocyanins. Candidate genes for the blue to red transition are shaded.
F<sc>IG</sc>. 2.
FIG. 2.
Differences in anthocyanin gene expression between Iochroma gesnerioides and Iochroma cyaneum. (A) F3′h, F3′5′h, Dfr, and Ans expression levels (±1 standard error) in floral tissue of three I. gesnerioides individuals and two I. cyaneum individuals relative to the single I. cyaneum parent from the crosses. Values of −1 and −2 correspond, respectively, to 10 and 100 times fewer copies of transcript relative to the I. cyaneum parental individual. **P < 0.001. (B) F3′h and F3′5′h expression in vegetative tissue of three I. gesnerioides individuals and two I. cyaneum individuals relative to expression in the floral tissue of the single I. cyaneum parent from the crosses. *P < 0.05.
F<sc>IG</sc>. 3.
FIG. 3.
Deletion of the functional F3′5′h copy in Iochroma gesnerioides. (A) Schematic diagram of functional and nonfunctional F3′5h copies showing the premature stop (octagon) and the 136 bp deletion in the nonfunctional copy, as well as the enzymes and probe (black bar) used in B and C. I. gesnerioides (“G”) and Iochroma cyaneum (“C”) gDNA were digested with HindIII (B) and EcoRI (C) and probed with the third exon of F3′5′h to reveal both copies. Open arrows indicate the nonfunctional copy present in both species; dark arrows show the presumed functional copy, absent in I. gesnerioides. The band marked with an asterisk is either a third copy of F3′5′h in I. cyaneum or represents nonspecific binding but is also absent in I. gesnerioides.
F<sc>IG</sc>. 4.
FIG. 4.
Floral pigment phenotypes in backcross populations. (A) The backcross to blue population had two distinct phenotypic classes: blue flowers with mostly delphinidin (open circles) and purple flowers with mostly cyanidin (gray circles). Blue flowers are homozygous for blue alleles at Dfr and purple flowers are heterozygous. (B) The backcross to red population had three distinct phenotypic classes: purple flowers with mostly cyanidin (gray circles), pink flowers with intermediate composition (open circles), and red flowers with 80% or more pelargonidin (black circles). Phenotypic classes in this backcross are determined largely by F3′5′h genotype and F3′h expression (fig. 6).
F<sc>IG</sc>. 5.
FIG. 5.
Relative efficiency of DFR enzyme from Iochroma cyaneum and Iochroma gesnerioides on precursors of anthocyanidins. DFR activity was assessed on DHK, DHQ, and DHM, the precursors for pelargonidin, cyanidin, and delphinidin, respectively (fig. 1). Relative efficiency is calculated as micromoles substrate converted/ total micromoles converted. Error bars indicate ±1 standard deviation across four replicates. The species differ significantly in relative efficiency on each substrate (MANOVA: I. cyaneum vs. I. gesnerioides, Wilks' λ = 0.005, P < 0.0001; univariate ANOVAs, F = 1128.00, 25.42, 45.60; and P = 0.0001***, 0.002**, 0.0005** for DHK, DHQ, and DHM, respectively).
F<sc>IG</sc>. 6.
FIG. 6.
Effects of F3′h expression and F3′5′h deletion in the backcross to red (BCR) population. (A) Relative expression of F3′h across 37 BCR individuals. Expression levels are shown relative to the blue Iochroma cyaneum parent; a value of −1.0 corresponds to 10-fold lower expression of F3′h relative to I. cyaneum. The arrow denotes the cutoff between low expression and high expression corresponding to low and high cyanidin classes in B. (B) F3′h expression versus cyanidin production in 37 BCR individuals. All individuals except one with expression greater than −1.0 produce mostly cyanidin (gray symbols). All individuals with expression lower than −1.0 produce mostly pelargonidin; these are divided into two groups: pink (50–80% pelargonidin, open symbols) and red (>80% pelargonidin, black symbols). (C) Combined effects of the F3′5′h and the inferred T-locus controlling F3′h expression in BCR. The cutoff between high and low F3′h expression follows (A). The average pelargonidin production for each genotypic combination is shown ±1 standard deviation. Black letters (T or F) denote a blue I. cyaneum allele and gray, a red I. gesnerioides allele. BCR individuals that lack a functional copy of F3′5′h (i.e., are homozygous for the red null allele at that locus) and have low F3′h expression (i.e., inferred to be homozygous for red alleles at the T-locus) recover the red parental phenotype (>80% pelargonidin production). Each of the four genotypic combinations (e.g., homozygous at both F3′5′h and T) includes individuals that are homozygous and heterozygous at Dfr.
F<sc>IG</sc>. 7.
FIG. 7.
Floral phenotypes, backcross genotypes, and pigment variation. (A) Flowers of the parents, the F1 hybrid, and the backcrosses are shown. The blue backcross has blue and purple phenotypes and the red backcross has purple, pink, and red phenotypes. Genotypes are given for each backcross phenotype at the three associated loci: the T-locus controlling F′3h expression, F3′5′h, and Dfr. Blue alleles at each locus are colored blue and red are red. T-locus genotypes were inferred from F3′h expression levels (fig. 6). Bar graphs show pigment composition for each genotype; D, C, and P are the mean proportions of each class of pigment (delphinidin, cyanidin, and pelargonidin) ±1 standard deviation. For analyses underlying this figure, see supplementary text, Supplementary Material Online. (B) Possible orders of changes to Dfr, F3′5′h, and T in the transition from blue to red flowers. Phenotypes follow the same four groupings observed in the backcrosses (A and fig. 4), blue, purple, pink, and red. The six possible paths are numbered for reference in the text. The two starred phenotypes are inferred from both the crosses and the structure of the pathway (fig. 1), whereas the remaining phenotypes can be inferred from the crosses alone.

Similar articles

Cited by

References

    1. Bridgham JT, Ortlund EA, Thornton JW. An epistatic ratchet constrains the direction of glucocorticoid receptor evolution. Nature. 2009;461:515–519. - PMC - PubMed
    1. Bull JJ, Charnov EL. On irreversible evolution. Evolution. 1985;39:1149–1155. - PubMed
    1. Cai DG, Kleine M, Kifle S, et al. (13 co-authors) Positional cloning of a gene for nematode resistance in sugar beet. Science. 1997;275:832–834. - PubMed
    1. Chen S, Matsubara K, Kokubun H, Kodama H, Watanabe H, Marchesi E, Ando T. Reconstructing historical events that occurred in the petunia Hf1 gene, which governs anthocyanin biosynthesis, and effects of artificial selection by breeding. Breed Sci. 2007;57:203–211.
    1. Colosimo PF, Hosemann KE, Balabhadra S, Villarreal G, Dickson M, Grimwood J, Schmutz J, Myers RM, Schluter D, Kingsley DM. Widespread parallel evolution in sticklebacks by repeated fixation of ectodysplasin alleles. Science. 2005;307:1928–1933. - PubMed

Publication types