

Identity gene expression in Proteus mirabilis
- PMID: 21551301
- PMCID: PMC3133265
- DOI: 10.1128/JB.01167-10
Identity gene expression in Proteus mirabilis
Abstract
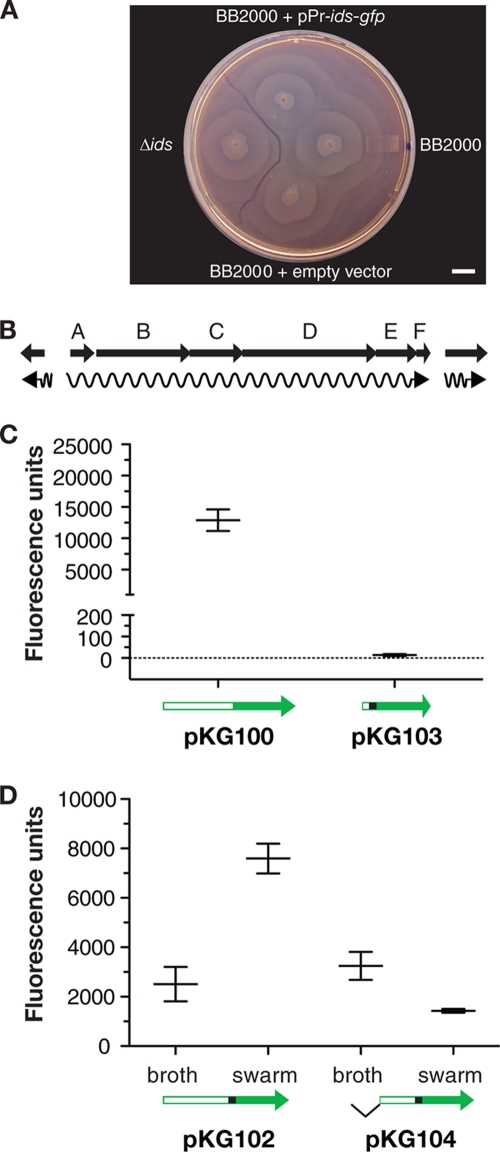
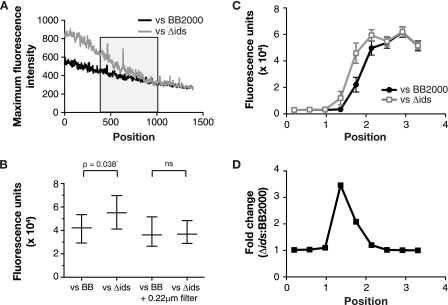
Swarming colonies of independent Proteus mirabilis isolates recognize each other as foreign and do not merge together, whereas apposing swarms of clonal isolates merge with each other. Swarms of mutants with deletions in the ids gene cluster do not merge with their parent. Thus, ids genes are involved in the ability of P. mirabilis to distinguish self from nonself. Here we have characterized expression of the ids genes. We show that idsABCDEF genes are transcribed as an operon, and we define the promoter region upstream of idsA by deletion analysis. Expression of the ids operon increased in late logarithmic and early stationary phases and appeared to be bistable. Approaching swarms of nonself populations led to increased ids expression and increased the abundance of ids-expressing cells in the bimodal population. This information on ids gene expression provides a foundation for further understanding the molecular details of self-nonself discrimination in P. mirabilis.
Figures


Similar articles
-
Two independent pathways for self-recognition in Proteus mirabilis are linked by type VI-dependent export.mBio. 2013 Jul 23;4(4):e00374-13. doi: 10.1128/mBio.00374-13. mBio. 2013. PMID: 23882014 Free PMC article.
-
Swarming-coupled expression of the Proteus mirabilis hpmBA haemolysin operon.Microbiology (Reading). 2002 Jul;148(Pt 7):2191-2201. doi: 10.1099/00221287-148-7-2191. Microbiology (Reading). 2002. PMID: 12101306 Free PMC article.
-
Genetic determinants of self identity and social recognition in bacteria.Science. 2008 Jul 11;321(5886):256-9. doi: 10.1126/science.1160033. Science. 2008. PMID: 18621670 Free PMC article.
-
Merging mythology and morphology: the multifaceted lifestyle of Proteus mirabilis.Nat Rev Microbiol. 2012 Nov;10(11):743-54. doi: 10.1038/nrmicro2890. Epub 2012 Oct 8. Nat Rev Microbiol. 2012. PMID: 23042564 Free PMC article. Review.
-
Swarmer cell differentiation in Proteus mirabilis.Environ Microbiol. 2005 Aug;7(8):1065-73. doi: 10.1111/j.1462-2920.2005.00806.x. Environ Microbiol. 2005. PMID: 16011745 Review.
Cited by
-
Two Proteins Form a Heteromeric Bacterial Self-Recognition Complex in Which Variable Subdomains Determine Allele-Restricted Binding.mBio. 2015 Jun 9;6(3):e00251. doi: 10.1128/mBio.00251-15. mBio. 2015. PMID: 26060269 Free PMC article.
-
Pathogenesis of Proteus mirabilis Infection.EcoSal Plus. 2018 Feb;8(1):10.1128/ecosalplus.ESP-0009-2017. doi: 10.1128/ecosalplus.ESP-0009-2017. EcoSal Plus. 2018. PMID: 29424333 Free PMC article. Review.
-
MrpJ Directly Regulates Proteus mirabilis Virulence Factors, Including Fimbriae and Type VI Secretion, during Urinary Tract Infection.Infect Immun. 2018 Sep 21;86(10):e00388-18. doi: 10.1128/IAI.00388-18. Print 2018 Oct. Infect Immun. 2018. PMID: 30082479 Free PMC article.
-
The Self-Identity Protein IdsD Is Communicated between Cells in Swarming Proteus mirabilis Colonies.J Bacteriol. 2016 Nov 18;198(24):3278-3286. doi: 10.1128/JB.00402-16. Print 2016 Dec 15. J Bacteriol. 2016. PMID: 27672195 Free PMC article.
-
Into the understanding the multicellular lifestyle of Proteus mirabilis on solid surfaces.Front Cell Infect Microbiol. 2022 Sep 2;12:864305. doi: 10.3389/fcimb.2022.864305. eCollection 2022. Front Cell Infect Microbiol. 2022. PMID: 36118021 Free PMC article. Review.
References
-
- Allison C., Emody L., Coleman N., Hughes C. 1994. The role of swarm cell differentiation and multicellular migration in the uropathogenicity of Proteus mirabilis. J. Infect. Dis. 169:1155–1158 - PubMed
Publication types
MeSH terms
Substances
Grants and funding
LinkOut - more resources
Full Text Sources
Other Literature Sources
