. 2011 Jun 15;186(12):6905-13.
doi: 10.4049/jimmunol.1100274. Epub 2011 May 6.

Tumor-infiltrating programmed death receptor-1+ dendritic cells mediate immune suppression in ovarian cancer

Affiliations

Tumor-infiltrating programmed death receptor-1+ dendritic cells mediate immune suppression in ovarian cancer

James Krempski et al. J Immunol. .

Abstract

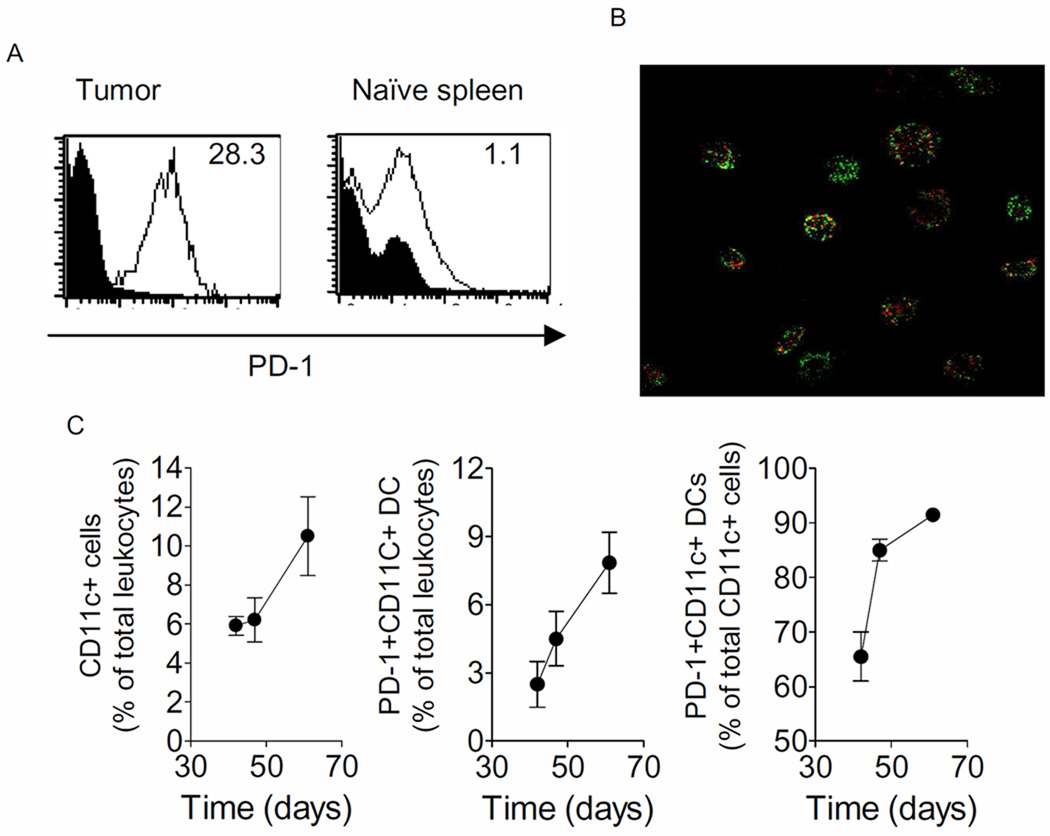
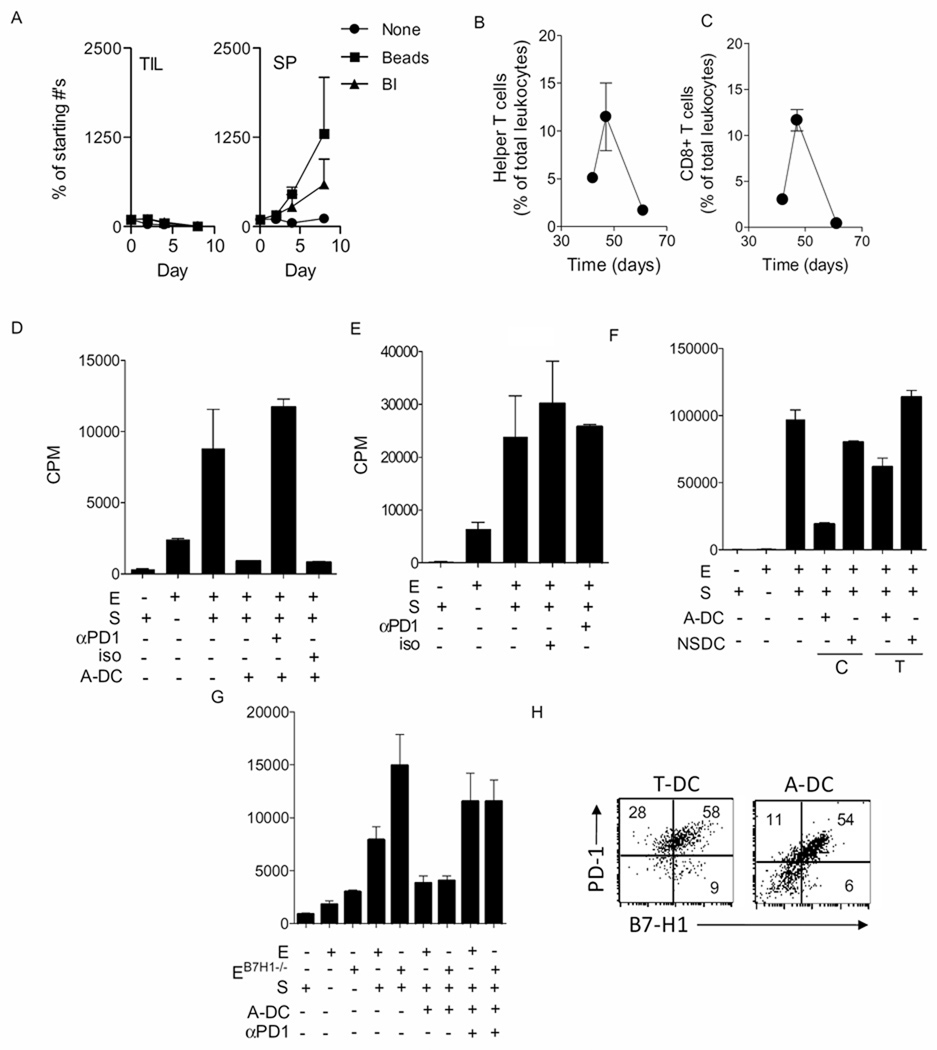
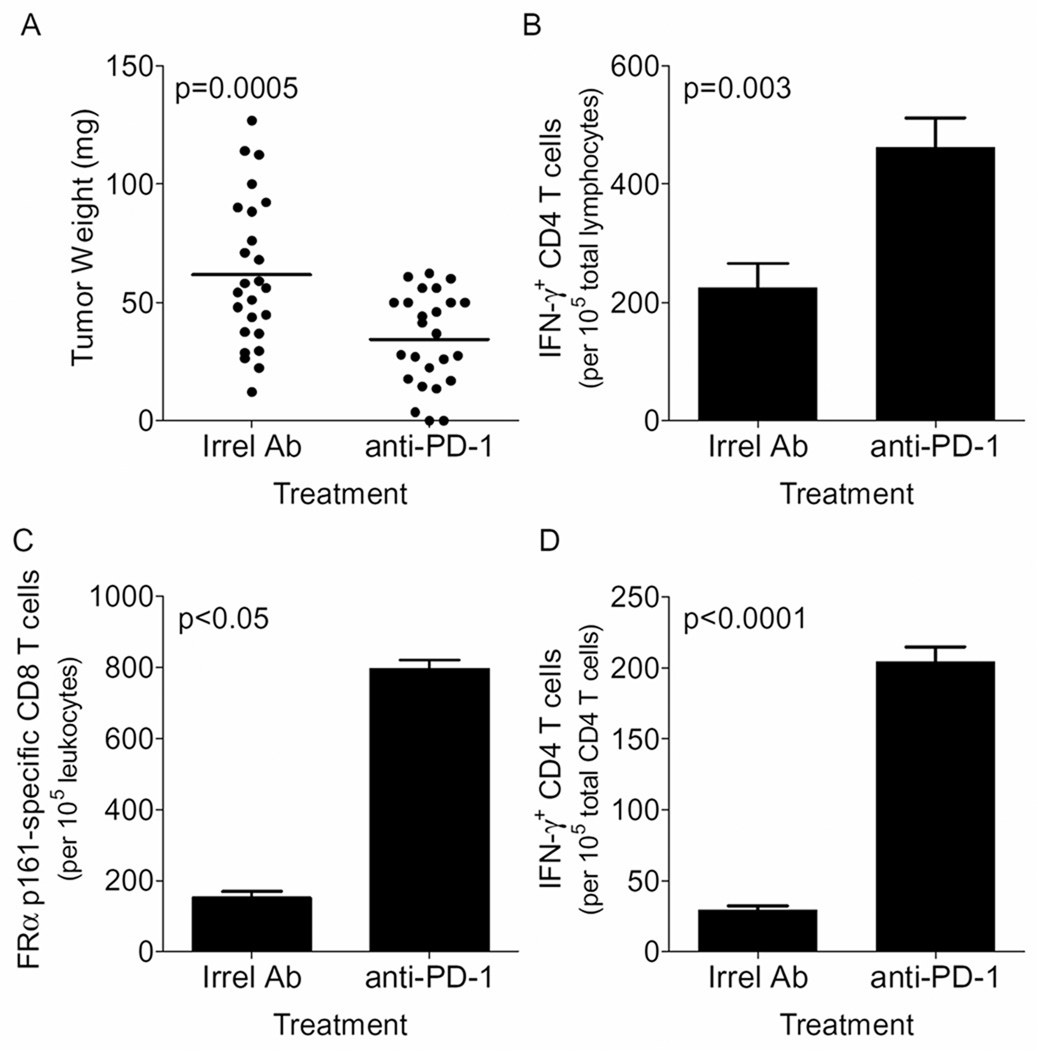
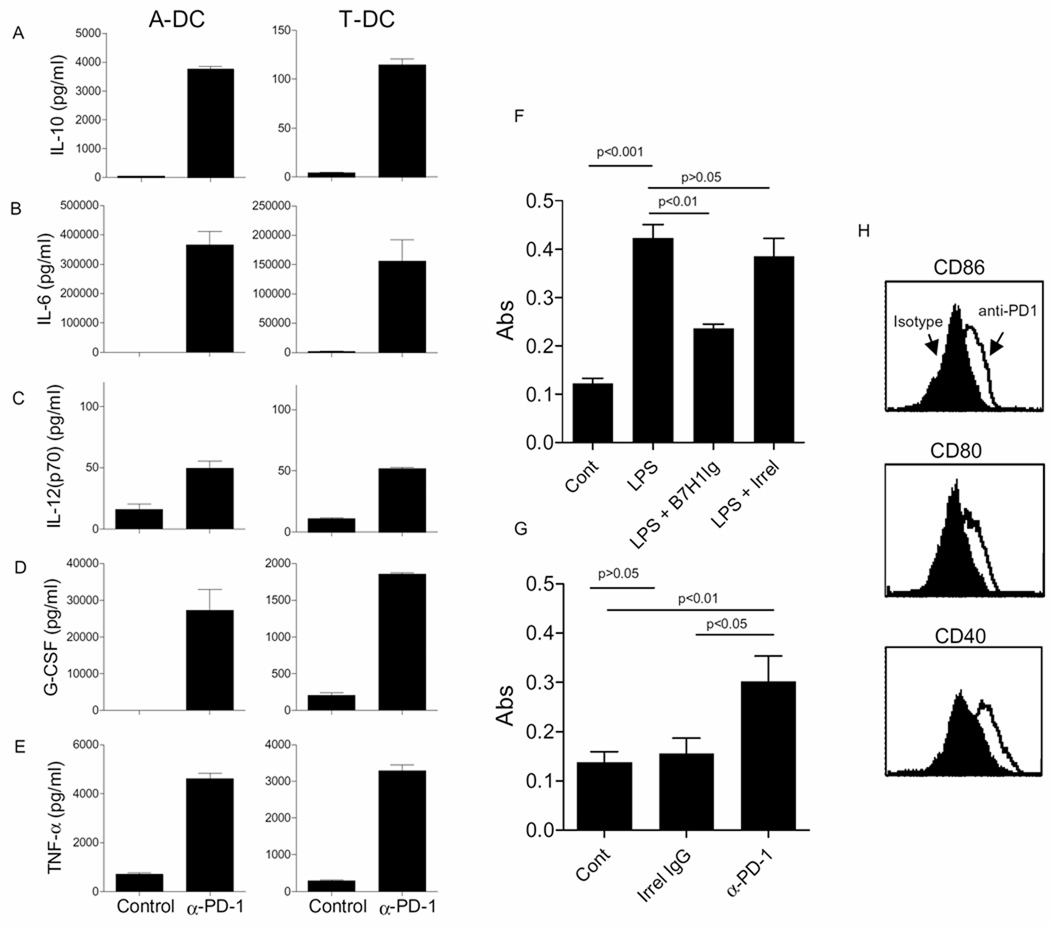
Within the ovarian cancer microenvironment, there are several mechanisms that suppress the actions of antitumor immune effectors. Delineating the complex immune microenvironment is an important goal toward developing effective immune-based therapies. A dominant pathway of immune suppression in ovarian cancer involves tumor-associated and dendritic cell (DC)-associated B7-H1. The interaction of B7-H1 with PD-1 on tumor-infiltrating T cells is a widely cited theory of immune suppression involving B7-H1 in ovarian cancer. Recent studies suggest that the B7-H1 ligand, programmed death receptor-1 (PD-1), is also expressed on myeloid cells, complicating interpretations of how B7-H1 regulates DC function in the tumor. In this study, we found that ovarian cancer-infiltrating DCs progressively expressed increased levels of PD-1 over time in addition to B7-H1. These dual-positive PD-1(+) B7-H1(+) DCs have a classical DC phenotype (i.e., CD11c(+)CD11b(+)CD8(-)), but are immature, suppressive, and respond poorly to danger signals. Accumulation of PD-1(+)B7-H1(+) DCs in the tumor was associated with suppression of T cell activity and decreased infiltrating T cells in advancing tumors. T cell suppressor function of these DCs appeared to be mediated by T cell-associated PD-1. In contrast, ligation of PD-1 expressed on the tumor-associated DCs suppressed NF-κB activation, release of immune regulatory cytokines, and upregulation of costimulatory molecules. PD-1 blockade in mice bearing ovarian cancer substantially reduced tumor burden and increased effector Ag-specific T cell responses. Our results reveal a novel role of tumor infiltrating PD-1(+)B7-H1(+) DCs in mediating immune suppression in ovarian cancer.


Conflict of interest statement

Conflicts of Interest: None

Figures

Figure 1
Figure 1. CD11c+ cells derived from the ovarian-cancer microenvironment demonstrate an immune suppressive phenotype
Panel A shows histograms of Ficoll-purified tumor-associated mononuclear cells (left panel, Pre-sort) and CD11c-sorted tumor-associated DC (right panel, Post-sort). Middle panel shows photomicrograph of CD11c-enriched cells adherent on glass cover slips. Rightmost panel shows tritium incorporation (CPM, counts per minute) into effector (E) cells in response to MHC mismatched stimulators (S) with varying concentrations of ascites-derived dendritic cells (A-DC). N=bone marrow derived DC at 1:1. Panel B shows concentrations of IL-6, IL-10 and G-CSF in the supernatants following short-term incubation of BMDC, splenic DC (NS), tumor-derived DC (T-DC), and ascites-derived DC (A-DC). Each bar is the mean and s.e.m. of six determinations and representative of three separate experiments. Panel C shows concentrations of IL-12p40 (left 2 panels) and IL-10 (right 2 panels) in the supernatants following short-term incubation of 5 × 10⁵ BMDC, NS, T-DC, and A-DC with or without LPS and CpG. Each bar is the mean and s.e.m. of two determinations and representative of three separate experiments.
Figure 2
Figure 2. Tumor-associated DCs have a non-activated CD11c+CD8Gr-1lo/intCD11b+ phenotype
Panel A shows cytometry dot plots of purified tumor-associated (from ascites and tumor) and splenic-derived CD11c+ DCs. All cells were gated on CD11c. Quadrants were established with isotype controls and the inset values are the percent of total CD11c cells that fall in that quadrant. Results are representative of 3 independent experiments. Panel B shows histograms of tumor associated DCs (left panel) and splenic DCs (naïve) (right panel) stained for CD209a. Inset numbers are the mean fluorescence intensity. Cells were gated on CD11c. Open histogram represents cells stained for CD209a and shaded histogram represents isotype staining.
Figure 3
Figure 3. Ovarian cancer-associated DCs co-express PD-1 and B7-H1 and accumulate in the ovarian cancer microenvironment
Panel A shows histograms of tumor (T)-associated DCs (at day 47 following tumor challenge) and splenic DCs (Naïve), respectively, stained for PD-1. Inset numbers are relative mean fluorescence intensity. Cells were gated on CD11c. Panel B are confocal photomicrographs of purified CD11c cells directly stained in culture with anti-PD-1 (Red) and anti-B7-H1 antibodies, respectively. Panel C estimates the proportion of CD11+ cells and PD-1+ DCs (middle) amongst the infiltrating leukocytes at days 42, 47, and 61. Rightmost panel estimates the proportion of PD-1+ DCs as a percentage of total CD11c+ cells on the same days. Shown are the means (±s.e.m.) of 2–3 replicates. Panels are representative of 3 independent experiments.
Figure 4
Figure 4. Ovarian cancer-associated DCs block T cell proliferation through PD-1 and in a contact-dependent manner
Panel A shows numbers of tumor infiltrating lymphocytes derived from tumor (TIL-T) (left panel) and splenocytes (SP) (right panel) cultured in the presence/absence of bryostatin/ionomycin (BI) and antiCD3/CD28 beads. Each data point is the mean (±s.e.m.) of 3–4 determinations and the experiment is representative of 3 or 4 experiments. Panels B and C shows the mean (±s.e.m.) proportions of helper/regulatory and CTL/regulatory (i.e. CD3+CD4+ T cells and CD3+CD8+ T cells respectively) on days 42, 47, and 61. T cells are expressed as a % of total leukocytes. Shown are the means (±s.e.m.) of 2–3 replicates. Panels are representative of 3 independent experiments. Panel D shows tritiated thymidine incorporation into effectors cells in an MLR assay in the absence or presence of A-DC. Some wells also contained either anti PD-1 antibody (αPD1) or an isotype control antibody (iso). Panel E shows titrated thymidine incorporation into effector cells in the wells containing either anti-PD-1 antibody (αPD1) or an isotype control antibody (iso). Panel F shows thymidine incorporation into effectors in the presence or absence of A-DC or NSDC. The DCs were either in direct contact (C) with the effectors or were separated by a transwell membrane (T). Panel G shows thymidine incorporation into effectors derived from normal B6 mice or B7-H1 knockout mice (B7H1−/−) in the presence or absence of A-DC and anti-PD-1 antibodies. In all panels, each bar is the mean and s.e.m. of three replicates. The experiment is representative of three similar experiments. Panel H shows dot plots of tumor (T)- or ascites (A)-associated DCs, respectively, at day 47 following tumor challenge, stained for B7-H1 on the x-axis and PD-1 on the y-axis. Inset numbers are the percentages for the respective quadrants. Cells were gated on CD11c.
Figure 5
Figure 5. PD-1 regulates ovarian cancer immunity in vivo
Panel A shows the tumor weight in milligrams in tumor-bearing mice treated with an irrelevant or PD-1-specific antibody. Tumor burden was measured on Day 40 following tumor challenge. Inset lines are bar is the mean of 25 mice, representative of five separate experiments. Panels BD shown are the mean (s.e.m) numbers of IFN-γ-producing T cells in the tumor (total IFN-γ+ CD4 T cells and FR161-specific CD8 T cells) and the spleen (total IFN-γ+ CD4 T cells), respectively, in mice treated with irrelevant or anti-PD-1 antibodies. IFN-γ+ CD4 T cells in Panels B and D were detected without stimulation. Values (mean ± s.e.m) in Panel B – D are calculated from 8, 3 and 5 replicates, respectively from 3 independent experiments.
Figure 6
Figure 6. PD-1 regulates cytokine production and NFκB activation by tumor-associated DCs
Panels A–E: Shown are the concentrations (pg/ml) of cytokines of IL-10, IL-6, IL-12p70, G-CSF and TNF-α, in cell culture supernatants of 2.5 × 10⁵ ascites (A-DC) or tumor (T-DC) DC cultured in the presence control antibody or soluble PD-1 antibody. Each bar is the mean (±s.e.m.) of 2 determinations and representative of 4 experiments. Panel F shows mean (±s.e.m) absorbance values obtained from ELISAs evaluating phospho-p65 in tumor-associated CD11c+ DCs incubated with media alone (Cont), LPS, LPS + B7-H1Ig or LPS+ irrelevant protein. Representative of 2 independent experiments. Panel G shows results of phospho-p65 ELISA using CD11c+ tumor DCs stimulated with media alone (Cont), irrel IgG or blocking anti-PD-1 antibodies. Shown are the means (±s.e.m.) calculated from 10–15 replicates. Results are representative of 5 experiments. Panel H shows histograms of CD86 (top), CD80 (middle) and CD40 (bottom) expression on CD11c sorted ascites-derived DCs cultured overnight in the presence of anti-PD-1 antibody or isotype antibody. Results are representative of 3 independent experiments.

Similar articles

Cited by

References

    1. Zhang L, Conejo-Garcia JR, Katsaros D, Gimotty PA, Massobrio M, Regnani G, Makrigiannakis A, Gray H, Schlienger K, Liebman MN, Rubin SC, Coukos G. Intratumoral T cells, recurrence, and survival in epithelial ovarian cancer. N. Engl. J. Med. 2003;348:203–213. - PubMed
    1. Sato E, Olson SH, Ahn J, Bundy B, Nishikawa H, Qian F, Jungbluth AA, Frosina D, Gnjatic S, Ambrosone C, Kepner J, Odunsi T, Ritter G, Lele S, Chen YT, Ohtani H, Old LJ, Odunsi K. Intraepithelial CD8+ tumor-infiltrating lymphocytes and a high CD8+/regulatory T cell ratio are associated with favorable prognosis in ovarian cancer. Proc. Natl. Acad. Sci. U S A. 2005;102:18538–18543. - PMC - PubMed
    1. Ho M, Hassan R, Zhang J, Wang QC, Onda M, Bera T, Pastan I. Humoral immune response to mesothelin in mesothelioma and ovarian cancer patients. Clin. Cancer Res. 2005;11:3814–3820. - PubMed
    1. Goodell V, Salazar LG, Urban N, Drescher CW, Gray H, Swensen RE, McIntosh MW, Disis ML. Antibody immunity to the p53 oncogenic protein is a prognostic indicator in ovarian cancer. J. Clin. Oncol. 2006;24:762–768. - PubMed
    1. Knutson KL, Krco CJ, Erskine CL, Goodman K, Kelemen LE, Wettstein PJ, Low PS, Hartmann LC, Kalli KR. T-cell immunity to the folate receptor alpha is prevalent in women with breast or ovarian cancer. J. Clin. Oncol. 2006;24:4254–4261. - PubMed

Publication types