. 2011 Apr;220(2):89-96.
doi: 10.1086/BBLv220n2p89.

Isolation and ultrastructural characterization of squid synaptic vesicles

Affiliations

Isolation and ultrastructural characterization of squid synaptic vesicles

Gulcin Pekkurnaz et al. Biol Bull. 2011 Apr.

Abstract

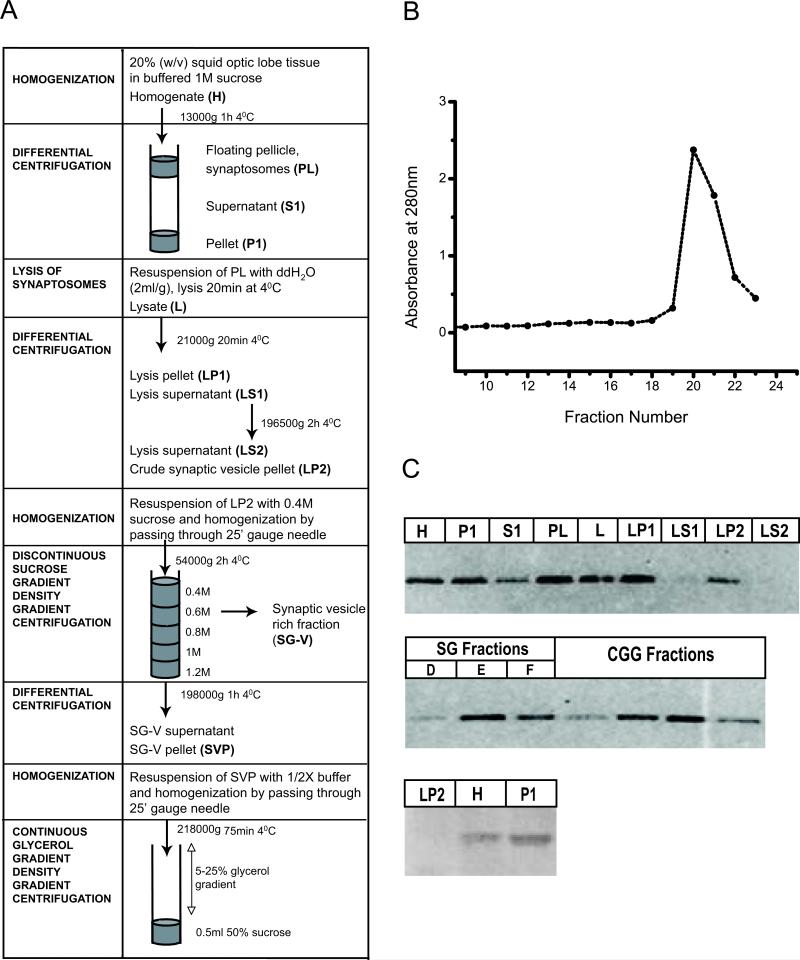
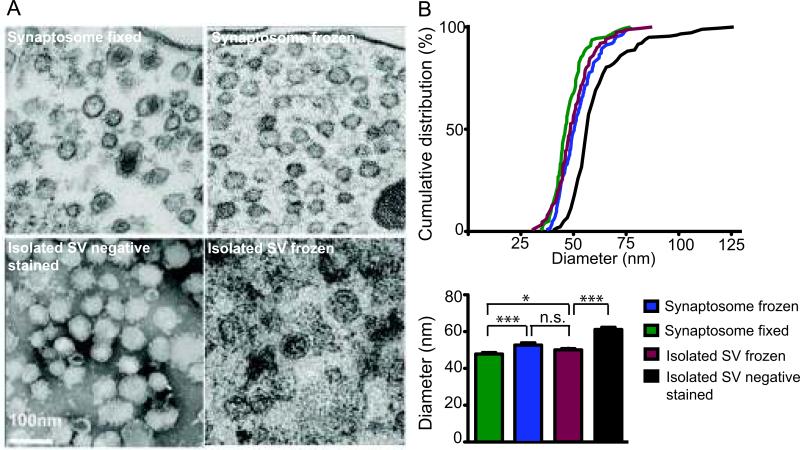
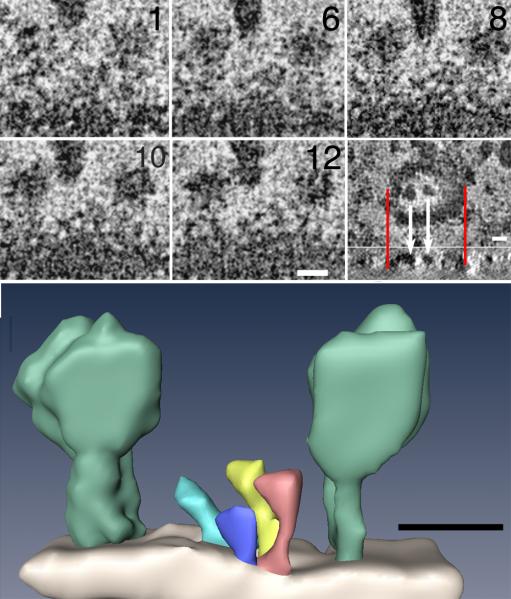
Synaptic vesicles contain a variety of proteins and lipids that mediate fusion with the pre-synaptic membrane. Although the structures of many synaptic vesicle proteins are known, an overall picture of how they are organized at the vesicle surface is lacking. In this paper, we describe a better method for the isolation of squid synaptic vesicles and characterize the results. For highly pure and intact synaptic vesicles from squid optic lobe, glycerol density gradient centrifugation was the key step. Different electron microscopic methods show that vesicle membrane surfaces are largely covered with structures corresponding to surface proteins. Each vesicle contains several stalked globular structures that extend from the vesicle surface and are consistent with the V-ATPase. BLAST search of a library of squid expressed sequence tags identifies 10 V-ATPase subunits, which are expressed in the squid stellate ganglia. Negative-stain tomography demonstrates directly that vesicles flatten during the drying step of negative staining, and furthermore shows details of individual vesicles and other proteins at the vesicle surface.


Figures

Figure 1
Figure 1
Synaptic vesicle enrichment by glycerol velocity sedimentation. (A) Scheme summarizing purification of synaptic vesicles from squid optic lobes. (B) Glycerol gradient fractions (250ml) collected from top to bottom and analyzed for their absorbance at 280nm. Major peak indicates synaptic vesicle rich fraction. (C) Electron micrograph of synaptic vesicle rich fraction (D) Western blot of subcellular fractions obtained during the synaptic vesicle purification steps (as described in Materials and Method) with mitochondrial marker; Anti-VDAC (40μg protein/lane) and synaptic marker Anti-SNAP25 (5μg protein/lane) antibodies.
Figure 2
Figure 2
Comparison of squid synaptic vesicle (SV) size by altering electron microscopy sample preparation technique in synaptosomes and isolated vesicles. (A) Electron micrograph of (left to right) fixed, embedded, thin-sectioned synaptosome; slam-frozen, freeze substituted synaptosome; negative stained isolated SVs and slam-frozen, freeze substituted isolated synaptic vesicles. (B) Cumulative distribution of synaptic vesicle diameters. Variations in mean synaptic vesicle diameter due to different sample preparation regimens (mean ± SEM, n= 125-175, Student's t-test; “*” = p< 0.03, “***” = p<0.001, n.s. = not significant).
Figure 3
Figure 3
(A) Five virtual sections, each 0.6 nm thick, extracted from different levels in a tomogram of a single negative stained synaptic vesicle. The external surface of the vesicle displays three prominent molecules (arrow). Synaptic vesicles collapse during negative staining, leaving other prominent molecules (arrowhead) on their collapsed external surfaces exposed to negative stain. Data have been adjusted for brightness and contrast, binned by two and spatially filtered to increase the signal-to-noise (S/N). Inset (lower right panel): Virtual section through vesicle in en-face plane showing how two large surface particles (white arrows) aligned with a cross sectional projection below. Red lines delineate two edges of vesicle above and the same edges below. Surface particles lie in a plane defined by the two edges of the vesicle, showing that the vesicle is flattened onto the substrate (below). (Scale bar = 10 nm). (B) Corresponding surface rendering of structures on the surface of the vesicle in A, including two of the more prominent ones (light green) whose sizes and shapes correspond to EM reconstructions of the V-ATPase of T. Thermophilus (Bernal and Stock, 2004). Smaller structures (other colors) are also evident on the surface of the vesicle. (Scale bar = 10 nm).

References

    1. Bennett MK, Calakos N, Kreiner T, Scheller RH. Synaptic vesicle membrane proteins interact to form a multimeric complex. J. Cell Biol. 1992;116:761–775. - PMC - PubMed
    1. Bernal RA, Stock D. Three-dimensional structure of the intact Thermus thermophilus H+-ATPase/synthase by electron microscopy. Structure. 2004;12:1789–1798. - PubMed
    1. Carlson SS, Wagner JA, Kelly RB. Purification of synaptic vesicles from elasmobranch electric organ and the use of biophysical criteria to demonstrate purity. Biochemistry (Mosc) 1978;17:1188–1199. - PubMed
    1. Chin GJ, Goldman SA. Purification of squid synaptic vesicles and characterization of the vesicle-associated proteins synaptobrevin and Rab3A. Brain Res. 1992;571:89–96. - PubMed
    1. Clift-O'Grady L, Linstedt AD, Lowe AW, Grote E, Kelly RB. Biogenesis of synaptic vesicle-like structures in a pheochromocytoma cell line PC-12. J. Cell Biol. 1990;110:1693–1703. - PMC - PubMed

Publication types

MeSH terms