. 2011 Aug;10(8):M111.009654.
doi: 10.1074/mcp.M111.009654. Epub 2011 May 7.

Correct interpretation of comprehensive phosphorylation dynamics requires normalization by protein expression changes

Affiliations

Correct interpretation of comprehensive phosphorylation dynamics requires normalization by protein expression changes

Ronghu Wu et al. Mol Cell Proteomics. 2011 Aug.

Abstract

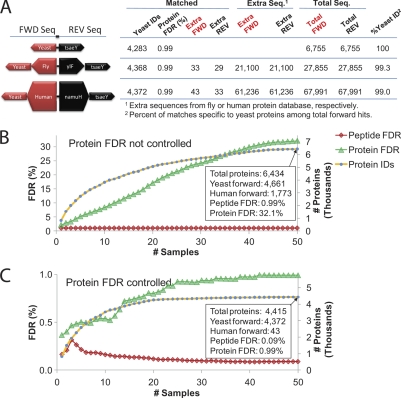
The interpretation of quantitative phosphoproteomics studies is complicated because each differential phosphorylation event integrates both changes in protein expression and phosphorylation. Here we investigated this phenomenon by performing parallel comparisons of protein expression and phosphorylation in S. cerevisiae. In each of two experiments comparing yeast mutants bearing deletions in FUS3 or STE7 with their wild-type counterparts, we quantified over 4100 proteins, including all members of the yeast mating pathway. We also identified 12,499 unique phosphorylation sites in this work. We demonstrate the critical importance of controlling the protein-level false-discovery rate and provide a novel method to assess the accuracy of protein false-discovery rate estimates. For the first time, 96% of nonredundant phosphopeptide ratios could be calibrated by protein levels, allowing truly differential phosphorylation to be distinguished from altered protein expression. This revealed a starkly different view, with 25% of seemingly differential phosphopeptides now attributed to changes in protein expression. Combined protein expression and phosphorylation surveys uncovered both independent and concerted changes in protein expression and phosphorylation, while highlighting the partially redundant role of a second MAPK (Kss1) in the mating pathway.


Figures

Fig. 1.
Fig. 1.
Experimental workflow. Wild-type yeast was grown in light SILAC labeling media containing normal isotopic abundance of lysine. Two yeast mutants (fus3Δ, and ste7Δ) were grown in media with lysine labeled with heavy isotopes of N and C (∼8 Da increase per lysine). Cultures were harvested at OD600 = 1.0 and then mixed such that fus3Δ:wt and ste7Δ:wt experiment were created. Each experiment was proteolyzed with lys-C. For protein analysis the workflow involved separation by HILIC with fraction collection. For phosphorylation analysis, a tandem affinity enrichment approach was used separating phosphopeptides first by SCX chromatography and then enriching them by IMAC. LC-MS/MS analysis of subsequent fractions was performed using an LTQ Orbitrap Velos system.
Fig. 2.
Fig. 2.
Collection of comprehensive yeast proteome data sets comparing wt yeast with two mating-pathway mutants (fus3Δ, ste7Δ). A, MAPK cascade controlling the mating pathway and the two mutants to be compared by metabolic labeling and LC-MS/MS techniques. B, Overview of the two data sets acquired in this study. C, D, Measured protein expression changes for fus3Δ:wt and ste7Δ:wt, respectively. Ratios represent protein-level fold changes and are plotted against the summed peptide signal-to-noise values from the MS. Proteins with known pheromone sensitivity or mating pathway function (yellow), and transposable elements (green) are highlighted. E, Validation of Kss1 protein level changes in fus3Δ cells. Kss1 levels were assessed by Western blotting in cells from both mating types and various MAPK pathway mutants. F, MS-based peptide ratios for one peptide (left) and all detected Kss1 peptides (right; error bars are ± one S.D.). Extracted ion chromatograms (±5 ppm) for light (wt) and heavy (fus3Δ) forms for the doubly charged Kss1-derived peptide sequence shown.
Fig. 3.
Fig. 3.
Validation of the accuracy of the identification rate (4283 proteins) and false discovery rate (FDR) in the two experiments. A, Three different yeast databases were used to search the MS/MS from the combined 50 samples from both experiments. Each yeast database also contained increasing amounts of known bogus sequences (e.g. randomized fly genome, randomized human genome) followed by a reversed complement of everything. More than 4300 yeast proteins were still identified even in the presence of up to 10× additional (incorrect) sequence. The protein FDR calculated based on the number of accepted reversed protein sequences was < 1%. The number of forward and reverse proteins accepted from fly and human was similar and less than 1% of identified yeast proteins, indicating that >4300 proteins were identified, and the FDR estimate is accurate. B, Combining 50 LC-MS/MS runs requires controlling both peptide- and protein-level FDRs. Cumulative plot for peptide and protein FDRs from 50 LC-MS/MS analyses using the combined yeast-human database in A. The peptide FDR was set to 1% for each fraction, but the protein FDR was uncontrolled. Final protein FDR climbed to 32.1% and 1773 human sequences (incorrect matches) were accepted. C, Same as in B, but all accepted proteins (6434) were now scored and then filtered to 1% FDR based on reversed protein sequences. The cumulative plot shows a greatly reduced peptide FDR and protein FDR that approaches 1%. Only 43 human sequences (incorrect) were accepted under these conditions.
Fig. 4.
Fig. 4.
Phosphoproteome data sets comparing wt yeast with two mating-pathway mutants (fus3Δ, ste7Δ). A, Total peptides and phosphopeptides detected in each of twelve SCX fractions in the fus3Δ:wt experiment using the hybrid dual cell linear ion trap-orbitrap MS. B, C, Summary of phosphorylation sites and phosphoproteins identified. D, E, Phosphorylation level analyses. Log2 ratio distributions for unique phosphopeptides analyzed. Note that greater than 3 S.D. changes were considered significant. F, Fraction of unique phosphopeptides in each data set for which protein normalization was performed. G, Fraction of up- and down-regulated (>3 S.D.) phosphopeptides after protein normalization.
Fig. 5.
Fig. 5.
Protein normalization profoundly affects the detection of regulated phosphorylation events. A, Summary of regulated phosphorylation events (>3 S.D.) before and after including protein calibration. Arrows show the direction of regulation. For example, 34% of down-regulated sites in a ste7Δ versus wt experiment became unregulated considering protein changes, and seven new sites achieved significance. B, Examples of the effect of protein normalization. C, Fold enrichment over background of the minimal MAPK consensus motif (Ser/Thr-Pro) for up- and down-regulated sites. The fraction (percent) of sites in each category containing this motif is shown above as a pie graph. No enrichment among regulated sites in the frequency of phosphorylated [ST]P was seen in the fus3Δ versus wt experiment presumably due to compensation by a redundant MAPK, Kss1. Ste7Δ downregulated sites were significantly more enriched for the MAPK motif compared with the entire data set, suggesting MAPK targets are now present. D, Phosphoproteins show more protein-protein interactions on average than non-phosphoproteins.
Fig. 6.
Fig. 6.
Protein and phosphorylation changes associated with FUS3 (A) and STE7 (B) gene deletion with no external stimulus in exponentially growing yeast. Protein abundance changes are shown as fold changes over wt levels from green to red. Phosphorylation changes are calibrated by protein levels and are also shown on the same scale. FUS3 deletion results in the up-regulation of Kss1 which can fulfill a partially redundant role. STE7 deletion results in the inability to activate either Fus3 or Kss1 as kinases. Even without pheromone or external stimulation, many mating-pathway-specific phosphorylation events are down-regulated and known Fus3 substrates have downregulated phosphorylation. All proteins were quantified at least once when considering both experiments, but Tec1and Ste7 (shown in gray) were only quantified in one.

Similar articles

Cited by

References

    1. Holt L. J., Tuch B. B., Villén J., Johnson A. D., Gygi S. P., Morgan D. O. (2009) Global analysis of Cdk1 substrate phosphorylation sites provides insights into evolution. Science 325, 1682–1686 - PMC - PubMed
    1. Olsen J. V., Vermeulen M., Santamaria A., Kumar C., Miller M. L., Jensen L. J., Gnad F., Cox J., Jensen T. S., Nigg E. A., Brunak S., Mann M. (2010) Quantitative phosphoproteomics reveals widespread full phosphorylation site occupancy during mitosis. Sci. Signal. 3, ra3. - PubMed
    1. Choudhary C., Olsen J. V., Brandts C., Cox J., Reddy P. N., Böhmer F. D., Gerke V., Schmidt-Arras D. E., Berdel W. E., Müller-Tidow C., Mann M., Serve H. (2009) Mislocalized activation of oncogenic RTKs switches downstream signaling outcomes. Mol. Cell. 36, 326–339 - PubMed
    1. Dephoure N., Zhou C., Villén J., Beausoleil S. A., Bakalarski C. E., Elledge S. J., Gygi S. P. (2008) A quantitative atlas of mitotic phosphorylation. Proc. Natl. Acad. Sci. U.S.A. 105, 10762–10767 - PMC - PubMed
    1. Wiśniewski J. R., Nagaraj N., Zougman A., Gnad F., Mann M. (2010) Brain Phosphoproteome Obtained by a FASP-Based Method Reveals Plasma Membrane Protein Topology. J. Proteome. Res. 9, 3280–3289 - PubMed

Publication types

MeSH terms

LinkOut - more resources