. 2011 Jun;8(6):506-15.
doi: 10.1038/nmeth.1606. Epub 2011 May 8.

In vivo protein trapping produces a functional expression codex of the vertebrate proteome

Affiliations

In vivo protein trapping produces a functional expression codex of the vertebrate proteome

Karl J Clark et al. Nat Methods. 2011 Jun.

Abstract

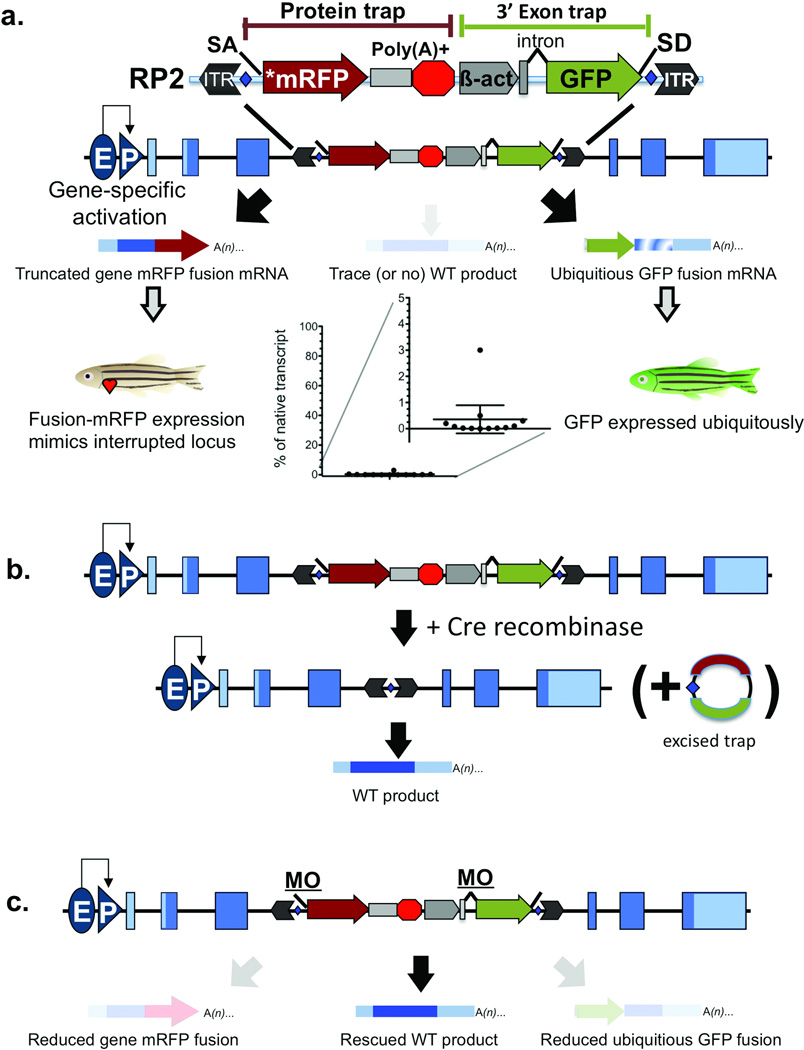
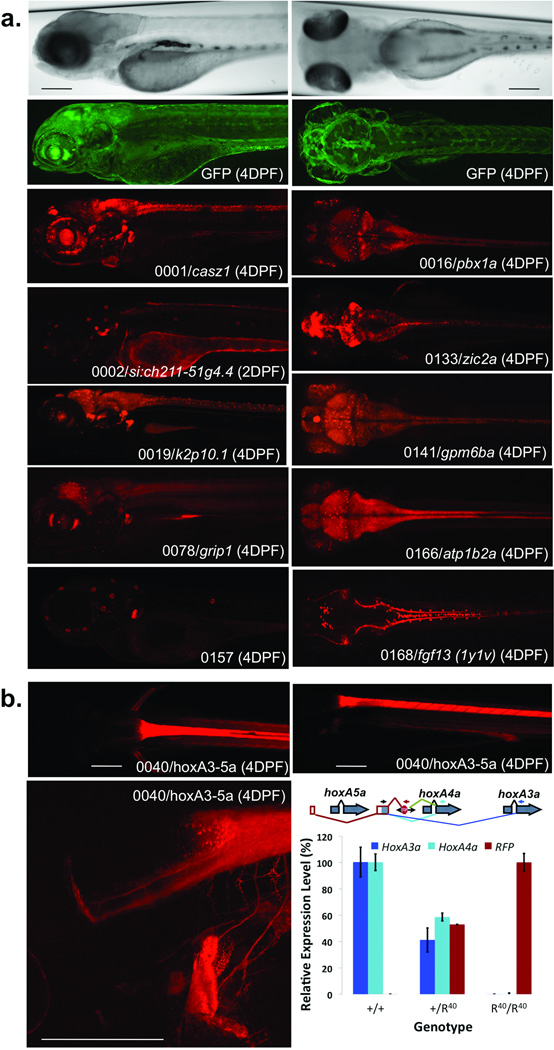
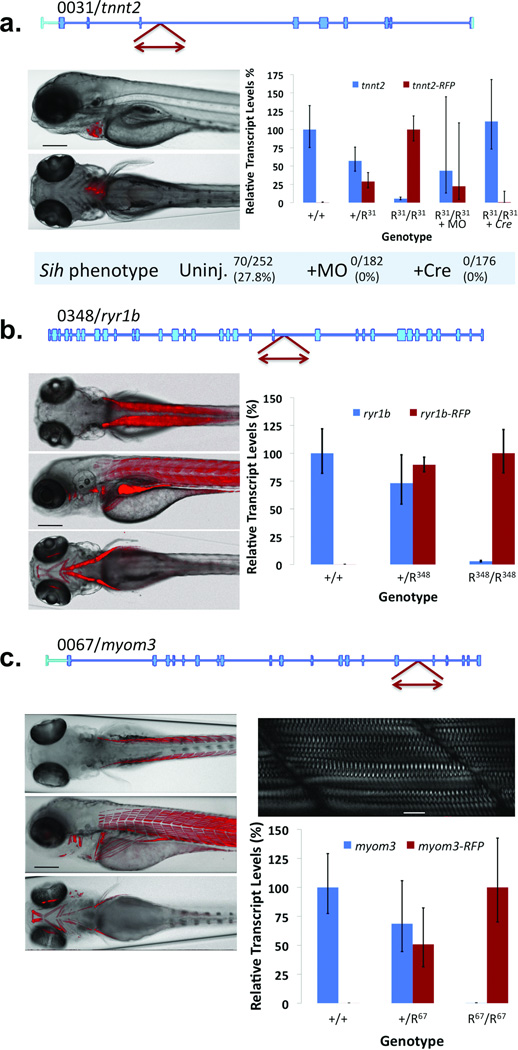
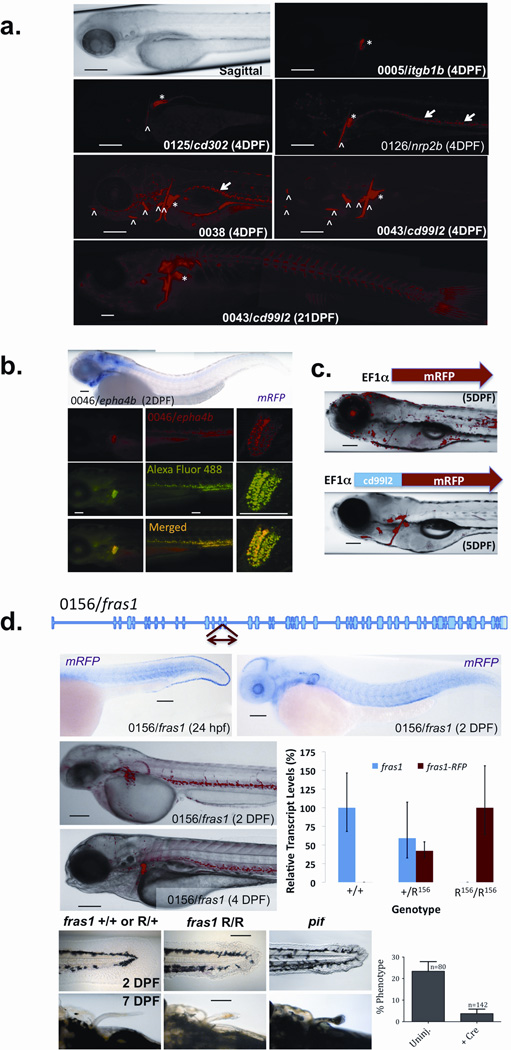
We describe a conditional in vivo protein-trap mutagenesis system that reveals spatiotemporal protein expression dynamics and can be used to assess gene function in the vertebrate Danio rerio. Integration of pGBT-RP2.1 (RP2), a gene-breaking transposon containing a protein trap, efficiently disrupts gene expression with >97% knockdown of normal transcript amounts and simultaneously reports protein expression for each locus. The mutant alleles are revertible in somatic tissues via Cre recombinase or splice-site-blocking morpholinos and are thus to our knowledge the first systematic conditional mutant alleles outside the mouse model. We report a collection of 350 zebrafish lines that include diverse molecular loci. RP2 integrations reveal the complexity of genomic architecture and gene function in a living organism and can provide information on protein subcellular localization. The RP2 mutagenesis system is a step toward a unified 'codex' of protein expression and direct functional annotation of the vertebrate genome.


Figures

Figure 1
Figure 1. RP2 Gene-Break Transposon and Reversion Systems
(a) The schematic shows the RP2 gene-break transposon system composed of a protein trap cassette with a transcriptional stop and 3’ exon trap cassette. The interrupted wild-type mRNA is either not produced or is produced at trace levels. (b) The schematic shows RP2 reversion with Cre recombinase. Blue diamonds show loxP sites flanking the mutagenic cassettes. By supplying Cre, the protein and 3’ exon traps are excised, resulting in normal levels of the nascent mRNA. (c) The schematic shows RP2 reversion with splice acceptor masking morpholinos. Both splice acceptors are derived from carp beta actin intron 1. ITR (inverted terminal repeat), SA (splice acceptor), *mRFP (AUG-less monomeric red fluorescent protein), Poly(A)+ (polyadenylation signal with extra transcriptional terminator and putative border element), β-act (carp beta actin enhancer, promoter, non-coding exon, and intron 1 sequences), GFP (green fluorescent protein), SD (splice donor), E (enhancer), P (promoter).
Figure 2
Figure 2. Protein Expression Codex
(a) The images show examples of protein trap expression patterns; they are maximal image projections of z-stacks in sagittal (left) and coronal (right) planes. Shown at the top are brightfield and corresponding GFP images of 4 DPF larvae. For each mRFP image, the identifier, gene name and age of the larval fish are indicated. Images are scaled similarly with the scale bar representing 200 µM. (b) The mRFP expression pattern in GBT0040, an integration within the HoxAa cluster between hoxA5a and hoxA4a. Scale bars represent 100 µM. The schematic demonstrates the annotated genes of this region of the hoxAa cluster. The red framed exons and red splicing lines show exons spliced to RP2. The green splice lines show the primary splice event from the 3’ exon trap and the dark and light blue splicing lines show alternative splicing identified by RT-PCR. The graph shows relative transcript abundance containing both the shared exon and indicated downstream cassette (hoxA3a, hoxA4a, or RFP) within the given genotypes (95% Confidence Interval, n = 4).
Figure 3
Figure 3. Protein Trap Integrations into muscle-specific genes
(a) Integration into the 5th intron of troponin T2 (GBT0031/tnnt2) results in mRFP expression in heart tissue. The plot shows relative transcript levels in fish of the indicated genotypes (n = 11) and after addition of splice acceptor masking morpholino (+MO, n = 8) or Cre recombinase (+Cre, n = 4) to homozygous mutant fish R31/R31 (tnnt2amn0031Gt/mn0031Gt). Error bars represent 95% confidence interval. Scale bar represents 200 µM. (b) Integration into the 37th intron of ryanodine receptor 1b (GBT0348/ryr1b) results in mRFP expression in fast-twitch muscle. The plot shows relative transcript levels in the indicated genotypes (95% confidence interval, n = 4). Scale bar represents 200 µM. (c) Integration into the 17th intron of myomesin 3 (GBT0067/myom3) results in mRFP expression in slow-twitch muscle in heterozygous (+/R67) or homozygous larvae (R67/R67 = myom3mn0067Gt/mn0067Gt). Scale bar in the bright-field fluorescent overlay, 200 µM; inset scale bar, 20 µM. The plot shows the relative transcript levels in the indicated genotypes (95% confidence interval, n = 4).
Figure 4
Figure 4. Secretion of mRFP fusions
(a) Representative images showing common patterns of mRFP accumulation of secretory lines. mRFP accumulation is marked by arrows in vessels or white blood cells, asterisks in kidney tubules, and carrots in bone. Scale bars represent 200 µM. (b) The top panel shows an in situ hybridization of an mRFP probe in a GBT0046/ephaA4b larva. Fluorescence images of the head, tail, and kidney tubules (also apparent in the head image) show mRFP in GBT0046/epha4b fish (top), an Alexa-Fluor 488 dextran-injected fish (middle), and a merged image (bottom). Scale bars represent 200µM. (c) The images demonstrate the effect of the cd99l2 N-terminal fusion on mRFP protein distribution within injected embryos. Scale bars represent 200 µM. (d) The schematic shows GBT integration into fras1 (GBT0156/fras1). Images show in situ hybridization of an mRFP probe (top) and mRFP expression in GBT0046/ fras1 larvae (middle). The plot shows the relative transcript levels in the indicated genotypes, (95% confidence interval, n = 4). The bottom panel of images show developing fins in larvae of the indicated genotypes (R156/R156 = fras1mn0156Gt/mn0156Gt, pif = fras1te262/te262). The plot (bottom right) shows the fraction of fras1mn0156Gt/mn0156Gt fish showing the fin phenotype with (+Cre) and without (uninj.) Cre mRNA (s.e.m., n = 3 families). Scale bars represent 200 µM.

Comment in

References

    1. Stevens CW. The evolution of vertebrate opioid receptors. Front Biosci. 2009;14:1247–1269. - PMC - PubMed
    1. Huxley-Jones J, Robertson DL, Boot-Handford RP. On the origins of the extracellular matrix in vertebrates. Matrix Biol. 2007;26:2–11. - PubMed
    1. Sauka-Spengler T, Bronner-Fraser M. Evolution of the neural crest viewed from a gene regulatory perspective. Genesis. 2008;46:673–682. - PubMed
    1. Balciunas D, et al. Harnessing a high cargo-capacity transposon for genetic applications in vertebrates. PLoS Genet. 2006;2:e169. - PMC - PubMed
    1. Urasaki A, Morvan G, Kawakami K. Functional dissection of the Tol2 transposable element identified the minimal cis-sequence and a highly repetitive sequence in the subterminal region essential for transposition. Genetics. 2006;174:639–649. - PMC - PubMed

Publication types