. 2011 Jun;43(6):519-25.
doi: 10.1038/ng.823. Epub 2011 May 8.

Genome partitioning of genetic variation for complex traits using common SNPs

Affiliations

Genome partitioning of genetic variation for complex traits using common SNPs

Jian Yang et al. Nat Genet. 2011 Jun.

Abstract

We estimate and partition genetic variation for height, body mass index (BMI), von Willebrand factor and QT interval (QTi) using 586,898 SNPs genotyped on 11,586 unrelated individuals. We estimate that ∼45%, ∼17%, ∼25% and ∼21% of the variance in height, BMI, von Willebrand factor and QTi, respectively, can be explained by all autosomal SNPs and a further ∼0.5-1% can be explained by X chromosome SNPs. We show that the variance explained by each chromosome is proportional to its length, and that SNPs in or near genes explain more variation than SNPs between genes. We propose a new approach to estimate variation due to cryptic relatedness and population stratification. Our results provide further evidence that a substantial proportion of heritability is captured by common SNPs, that height, BMI and QTi are highly polygenic traits, and that the additive variation explained by a part of the genome is approximately proportional to the total length of DNA contained within genes therein.


Conflict of interest statement

COMPETING FINANCIAL INTERESTS

The authors declare no competing financial interests.

Figures

Figure 1
Figure 1
Estimate of the variance explained by each chromosome for height, BMI, vWF and QTi by the joint analysis using unrelated individuals against chromosome length. The numbers in the circles/squares are the chromosome numbers.
Figure 2
Figure 2
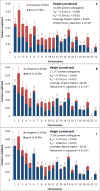
Estimates of the variance explained by genic and intergenic regions on each chromosome for height by the joint analysis using 11,586 unrelated individuals. The genic region is defined as ± 0 Kb (a), ± 20 Kb (b) and ± 50 Kb (c) of the 3′ and 5′ UTRs. Error bars are the standard errors of the estimates. hGg2 and hGi2 are the variances explained by all the genic and intergenic SNPs across the whole genome. P(observed vs. expected): goodness-of-fit test of the estimated hGg2/hG2 against that expected from the coverage of genic regions.
Figure 3
Figure 3
Difference between the estimates of variance explained by each chromosome by the separate ( hC2(sep)) and joint ( hC2) analyses for height, BMI, vWF and QTi against chromosome length. All: using all the individuals in the entire sample. Unrelated: using unrelated individuals after excluding one of each pair of individuals with an estimate of genetic relationship > 0.025.
Figure 4
Figure 4
The sum of variance explained by the GWAS associated SNPs on each chromosome in the GIANT meta-analysis (MA) of height against the estimate of variance explained by each chromosome for height by the joint analysis using the combined data of 11,586 unrelated individuals in the present study. The variance explained by GWAS loci in the GIANT MA was calculated based on the result of its replication study.

References

    1. Hindorff LA, et al. Potential etiologic and functional implications of genome-wide association loci for human diseases and traits. Proc Natl Acad Sci USA. 2009;106:9362–7. - PMC - PubMed
    1. Manolio TA, et al. Finding the missing heritability of complex diseases. Nature. 2009;461:747–753. - PMC - PubMed
    1. Manolio TA. Genomewide association studies and assessment of the risk of disease. N Engl J Med. 2010;363:166–76. - PubMed
    1. Yang J, et al. Common SNPs explain a large proportion of the heritability for human height. Nat Genet. 2010;42:565–9. - PMC - PubMed
    1. Visscher PM, et al. Genome partitioning of genetic variation for height from 11,214 sibling pairs. Am J Hum Genet. 2007;81:1104–10. - PMC - PubMed

Publication types

Substances