. 2011 Jun;12(6):527-35.
doi: 10.1038/ni.2036. Epub 2011 May 8.

Genetic analysis of basophil function in vivo

Affiliations

Genetic analysis of basophil function in vivo

Brandon M Sullivan et al. Nat Immunol. 2011 Jun.

Erratum in

  • Nat Immunol. 2011 Jun;12(6):3 p following 535

Abstract

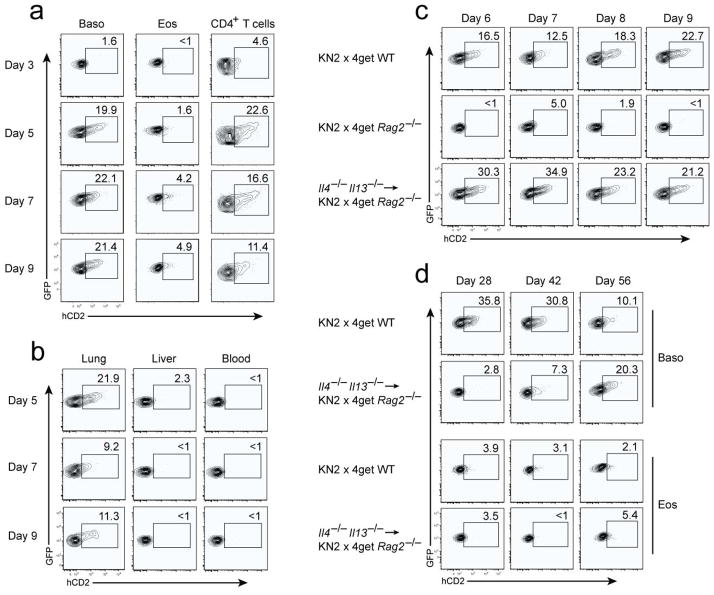
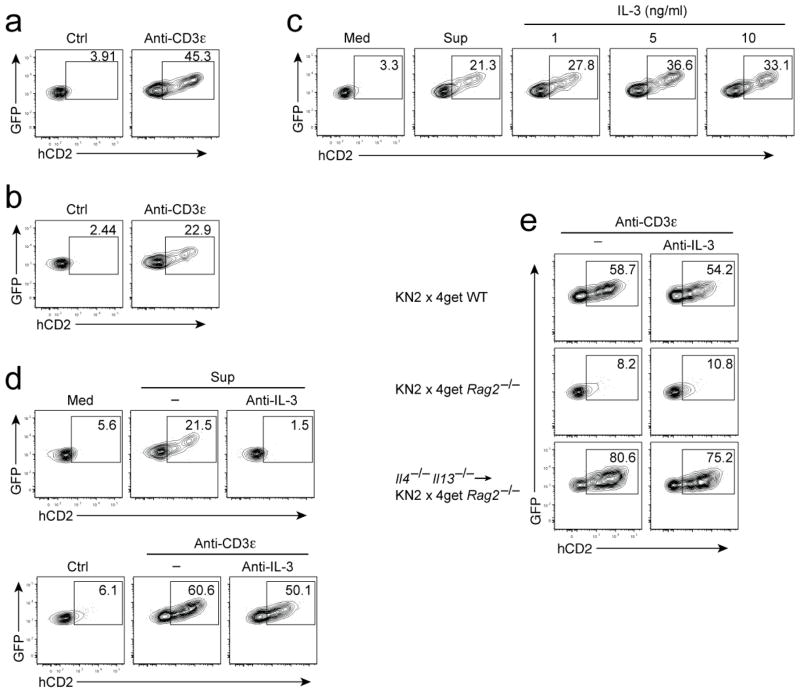
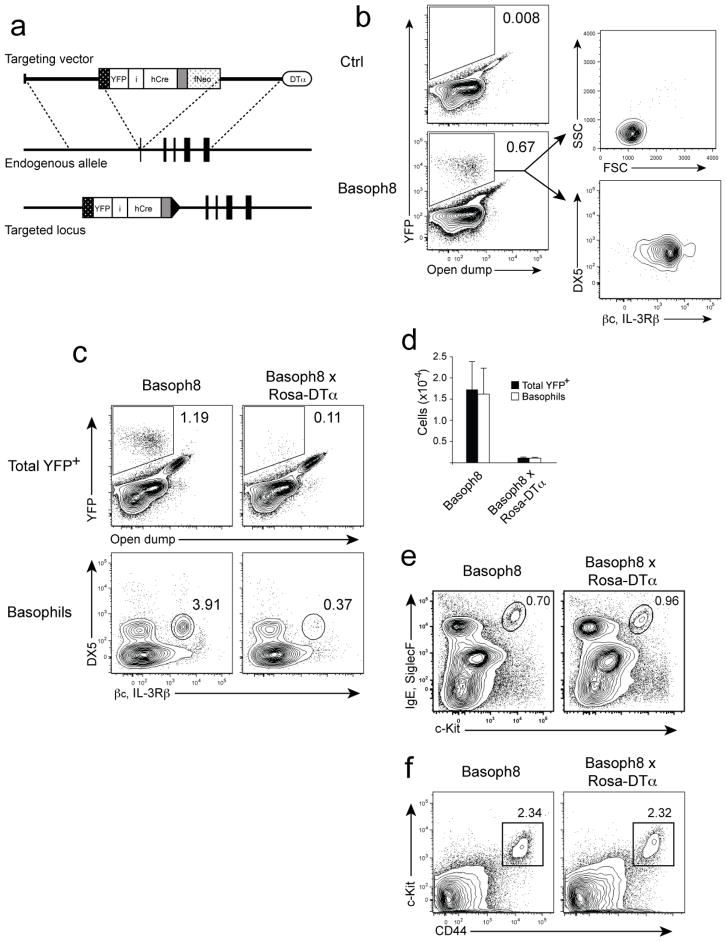
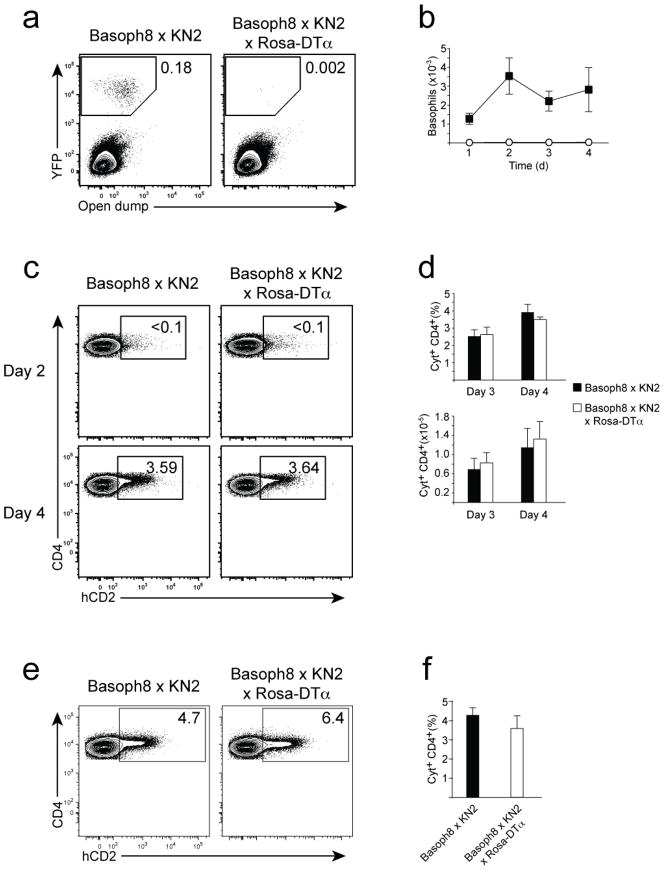
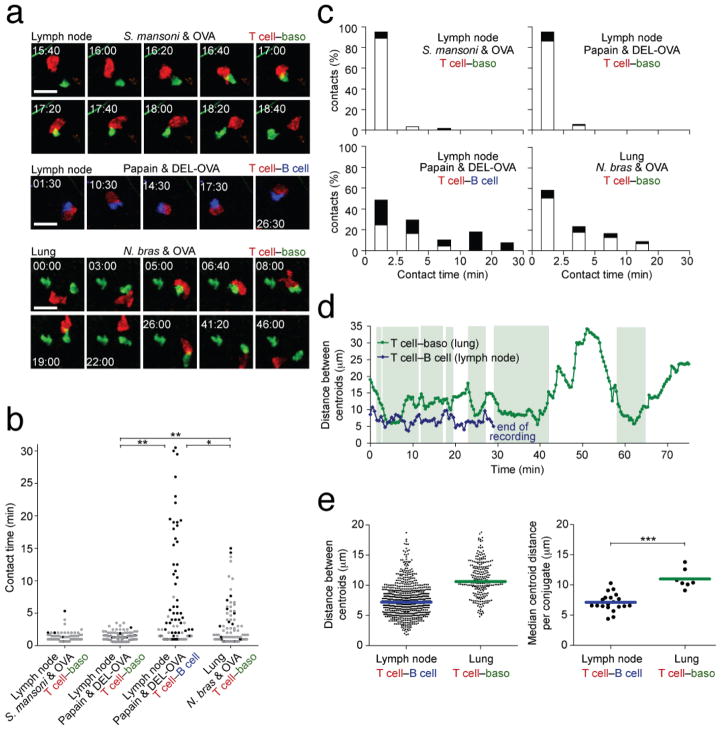
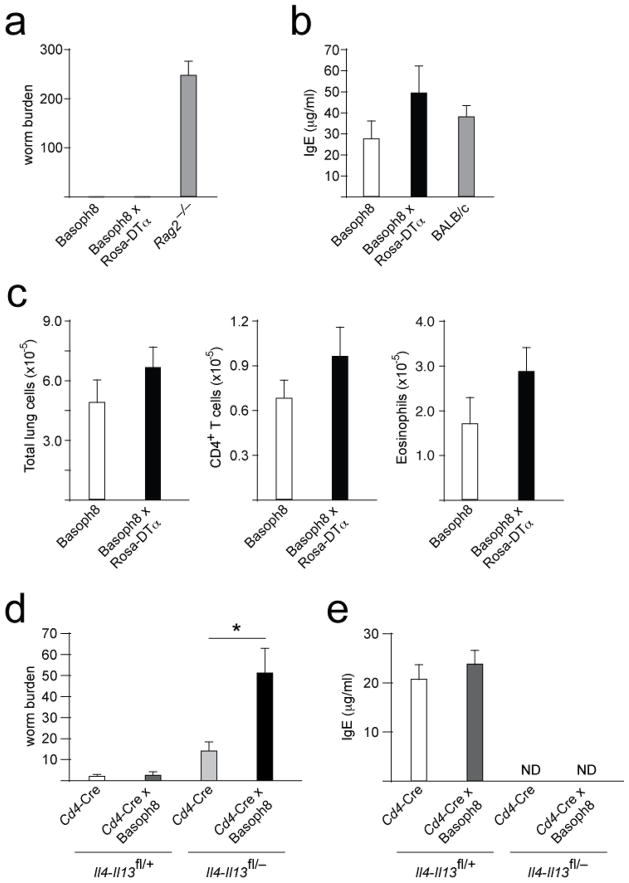
Contributions by basophils to allergic and helminth immunity remain incompletely defined. Using sensitive interleukin 4 (Il4) reporter alleles, we demonstrate here that basophil IL-4 production occurs by a CD4(+) T cell-dependent process restricted to the peripheral tissues affected. We genetically marked and achieved specific deletion of basophils and found that basophils did not mediate T helper type 2 (T(H)2) priming in vivo. Two-photon imaging confirmed that basophils did not interact with antigen-specific T cells in lymph nodes but engaged in prolonged serial interactions with T cells in lung tissues. Although targeted deletion of IL-4 and IL-13 in either CD4(+) T cells or basophils had a minimal effect on worm clearance, deletion from both lineages demonstrated a nonredundant role for basophil cytokines in primary helminth immunity.


Conflict of interest statement

The authors declare no competing financial interests.

Figures

Figure 1
Figure 1. IL-4 production by basophils following parasite infection is restricted to affected tissues
(a) Flow cytometric analysis of IL-4-competent (GFP+) cells from the lungs of N. brasiliensis-infected KN2 × 4get mice. The gating scheme is presented (Supplementary Fig. 11). Eosinophils and basophils were initially gated as DAPI, GFP+ and CD4. Eosinophils are additionally SSChi, DX5, whereas basophils are DX5+, SSClo. In an effort to normalize the data to all IL-4-competent subsets, only GFP+ CD4+ T cells are presented. Numbers represent the percent hCD2 minus the percent isotype control for each individual cell population at indicated timepoints. (b) Flow cytometric analysis of hCD2 expression by lung, liver and blood basophils, presented as in (a). (c) IL-4 protein expression, as assessed by membrane hCD2, by lung basophils from KN2 × 4get mice, KN2 × 4get Rag2−/− mice, and KN2 × 4get Rag2−/− mice reconstituted with Il4−/− Il13−/−CD4+ T cells following N. brasiliensis infection. Data are presented as in (a). (d) Flow cytometric analysis of liver basophils and eosinophils from S. mansoni infected KN2 × 4get mice and KN2 × 4get Rag2−/− mice reconstituted with Il4−/− Il13−/− CD4+ T cells, presented as in (a). Data presented are representative plots from 3–5 independent experiments.
Figure 2
Figure 2. CD4+ T cell activation induces basophil IL-4 production in vitro
(a) IL-4 expression by basophils following anti-CD3ε stimulation of total splenocytes from N. brasiliensis-infected KN2 × 4get mice. (b) IL-4 expression by basophils enriched from the spleens of KN2 × 4get Rag2−/− mice following anti-CD3ε stimulation of purified CD4+ T cells separated by a transwell. (c) IL-4 expression by basophils enriched from the spleens of KN2 × 4get Rag2−/− mice after overnight culturing in activated CD4+ T cell supernatant or recombinant IL-3 at the indicated concentrations. (d) Effect of neutralizing anti-IL-3 antibody (10 μg/ml) on basophil IL-4 production during stimulation of total splenocytes, as in (a), and culturing with activated CD4+ T cell supernantant, as in (c). (e) IL-4 expression by basophils enriched from the spleens of N. brasiliensis infected KN2 × 4get, KN2 × 4get Rag2−/− and KN2 × 4get Rag2−/− mice reconstituted with Il4−/− Il13−/− CD4+ T cells, and stimulated in vitro as in (a and d). Data presented are representative of 2–4 independent experiments.
Figure 3
Figure 3. Basophil lineage tracking and deletion in vivo
(a) Schematic illustrating the mcpt8 targeting strategy used to generate Basoph8 mice. A detailed map and screening of the successful targeting is presented (Supplementary Fig. 4) (b) Flow cytometric analysis of YFP expression in the lung of Basoph8 reporter mice following N. brasiliensis infection. Total DAPI, YFP+ cells were initially gated based on a non-reporter control. YFP+ cells were then assessed for expression of characteristic basophil surface markers. (c) Flow cytometric analysis of basophils in the Basoph8 reporter strain and the basophil deficient Basoph8 × Rosa-DTα. Total YFP+ cells are presented as in (b). Basophils were isolated by conventional flow cytometry by first gating total DAPI, SSClo, CD4 cells and then subsequent isolation of basophils by their DX5+, βc (CD131), IL-3Rβ+ expression profile. (d) Comparison of basophil numbers versus YFP+ cells, isolated as in (c), in both Basoph8 reporter mice and basophil-deficient Basoph8 × Rosa-DTα mice from the lung following N. brasiliensis infection. The graph represents data compiled from 2 independent experiments, 7–8 mice per group. (e) Flow cytometry of peritoneal mast cells from N. brasiliensis-infected mice. (f) Isolation of skin resident mast cell populations in Basoph8 and Basoph8 × Rosa-DTα mice. Plots are representative of 2–4 independent experiments.
Figure 4
Figure 4. Efficient CD4+ T cell priming in the absence of basophils
(a) Representative flow cytometric analysis of total YFP+ cells in the draining popliteal node 48 hours after S. mansoni egg footpad immunization. Plots represent total live (DAPI) lymph node cells. (b) Total basophil numbers in the draining node following footpad injection of S. mansoni eggs. Data represents the compilation of 3 experiments in which 2–3 mice were analyzed per group, at each timepoint. (c) Flow cytometry of cytokine-positive CD4+ T cells, as assessed by hCD2 surface expression, in the draining node 4 days after S. mansoni egg immunization. Plots represent total CD4+, DAPI cells, and hCD2 staining was analyzed as in (Supplementary Fig. 11) (d). The graphs represent the percent of hCD2+, cytokine-producing CD4+ T cells (top) and the total number of cytokine positive CD4+ T cells (bottom) on days 3 and 4. Data was compiled from 3 independent experiments as in (b) and is presented as the mean ± SEM. (e) Representative flow cytometric analysis of hCD2+ CD4+ T cells, as in (c), 72 h following papain (50 μg) footpad immunization. (f) Percent cytokine positive CD4+ T cells compiled from 3 independent experiments with 2–3 mice per group presented as the mean ± SEM.
Figure 5
Figure 5. Basophils and CD4+ T cells interact in the lungs but not in lymph nodes
(a) Representative time-lapse images of contacts between the indicated cell types. Images are maximum intensity z-projections (upper, middle, and lower are 33 μm, 30 μm and 28 μm projections, respectively) from cropped two-photon microscopy image stacks. The contacts in the middle and lower panels are further characterized in (d and Supplementary Fig. 8). The lower panels (lung) correspond to Supplementary Video 4. Elapsed time is shown as min:sec. Scale bars, 20 μm. (b) Duration of contacts observed between the indicated cell types. Each dot represents the duration of a single contact. Grey circles indicate contacts that could be completely observed from start to finish, whereas black dots represent contacts that could not be tracked for their entire duration, typically because the conjugate entered or exited the imaging volume or exceeded the duration of the recording. The black dot measurements therefore are underestimates. *, P < 0.05; **, P < 0.01 (Kruskal-Wallis test). (c) Histograms compiling the data in b. Black bar segments indicate conjugates that could not be tracked for their entire duration. (d) Measurements of the distance between cell centroids for the cell contacts shown in a. The T cell and basophil were only in contact during the time periods that are shaded in light green. In contrast, the T cell-B cell conjugate shown persisted for the entire duration of a 30-minute timelapse recording. (e) On the left panel, dots represent single timepoint measurements of the distance between cell centroids for cells that remained in contact for longer than eight minutes. Measurements are only shown for the timepoints in which the cells were directly in contact with each other. These data are compiled on the right panel, showing the median centroid distance for each cell conjugate that lasted greater than eight minutes. *, P = 0.0003 (Mann-Whitney U-test).
Figure 6
Figure 6. Basophil derived cytokines contribute to anti-helminth immunity
(a) Worm burden in the small intestine 10 days following primary N. brasiliensis infection. Data was compiled from 3 independent experiments in which 3–5 mice per group were infected. (b) Serum IgE concentrations of cohorts in (a) and BALB/c control mice. (c) Analysis of the inflammatory response in the lung of experiments presented in (a). Cellularity was determined by flow cytometric analysis. (d) Worm burden in the small intestine as in (a). Data represents the compilation of 2 experiments and a total of 5–8 mice per group. *, P = 0.0036 (e) Serum IgE concentrations from the cohorts presented in (d). Data in each panel is presented as the mean ± SEM.

Similar articles

Cited by

References

    1. Chan MS. The global burden of intestinal nematode infections--fifty years on. Parasitol Today. 1997;13:438–443. - PubMed
    1. Urban JF, Jr, Maliszewski CR, Madden KB, Katona IM, Finkelman FD. IL-4 treatment can cure established gastrointestinal nematode infections in immunocompetent and immunodeficient mice. J Immunol. 1995;154:4675–4684. - PubMed
    1. Urban JF, Jr, et al. IL-13, IL-4Ralpha, and Stat6 are required for the expulsion of the gastrointestinal nematode parasite Nippostrongylus brasiliensis. Immunity. 1998;8:255–264. - PubMed
    1. Voehringer D, Reese TA, Huang X, Shinkai K, Locksley RM. Type 2 immunity is controlled by IL-4/IL-13 expression in hematopoietic non-eosinophil cells of the innate immune system. J Exp Med. 2006;203:1435–1446. - PMC - PubMed
    1. Neill DR, et al. Nuocytes represent a new innate effector leukocyte that mediates type-2 immunity. Nature. 2010;464:1367–1370. - PMC - PubMed

Publication types

MeSH terms