Comparative Study
. 2011 May 8;29(6):512-20.
doi: 10.1038/nbt.1852.

Comprehensive assessment of array-based platforms and calling algorithms for detection of copy number variants

Affiliations
Comparative Study

Comprehensive assessment of array-based platforms and calling algorithms for detection of copy number variants

Dalila Pinto et al. Nat Biotechnol. .

Abstract

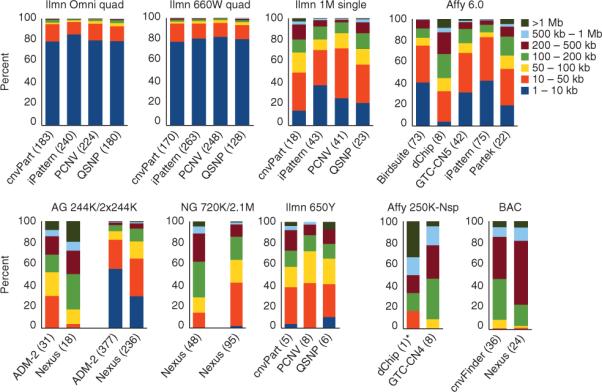
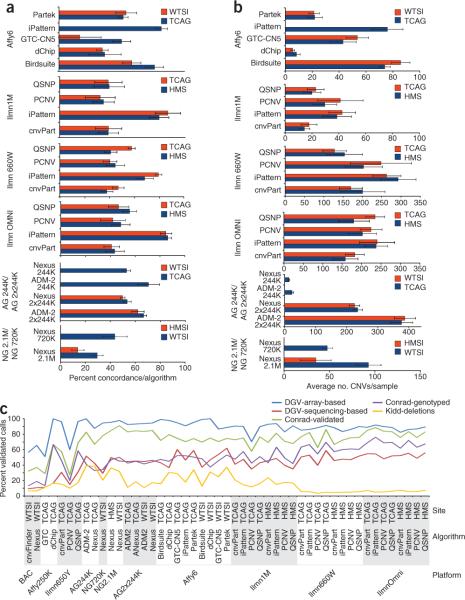
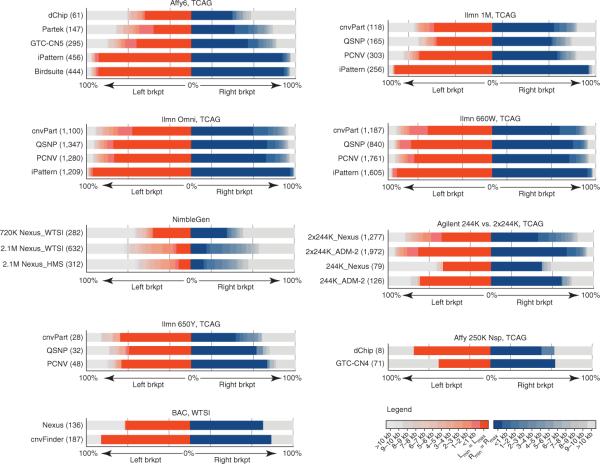
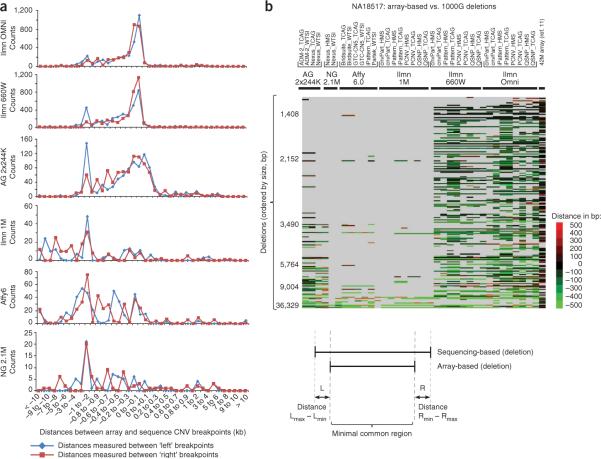
We have systematically compared copy number variant (CNV) detection on eleven microarrays to evaluate data quality and CNV calling, reproducibility, concordance across array platforms and laboratory sites, breakpoint accuracy and analysis tool variability. Different analytic tools applied to the same raw data typically yield CNV calls with <50% concordance. Moreover, reproducibility in replicate experiments is <70% for most platforms. Nevertheless, these findings should not preclude detection of large CNVs for clinical diagnostic purposes because large CNVs with poor reproducibility are found primarily in complex genomic regions and would typically be removed by standard clinical data curation. The striking differences between CNV calls from different platforms and analytic tools highlight the importance of careful assessment of experimental design in discovery and association studies and of strict data curation and filtering in diagnostics. The CNV resource presented here allows independent data evaluation and provides a means to benchmark new algorithms.


Figures

Figure 1
Figure 1
Size distribution of CNV calls. The size distribution for the high-confidence CNV calls (that is, CNV calls made in at least two of three replicates) is shown for all combinations of algorithms (Table 1, CNV analysis tools) and platforms. Each bin represents a different range of CNV lengths and the bars show the percentage of CNVs falling into each size bin. Representative results are shown for one genotyping site only, where the average number of CNVs per sample for that site is given in parentheses. The size distribution is therefore not representative of a sample. Instead, it represents the sizes of CNV calls detected in a total of six samples. Results for all sites and further breakdown into gains-only and losses-only can be found in Supplementary Figure 4. *For Affymetrix 250K-Nsp, dChip detects on average one CNV per sample. Affy, Affymetrix; Ilmn, Illumina; AG, Agilent; BAC, bacterial artificial chromosome; cnvPart, cnvPartition; NG, NimbleGen; PCNV, PennCNV; QSNP, QuantiSNP.
Figure 2
Figure 2
CNV calling reproducibility. (ac) Call reproducibility was evaluated by either comparing calls obtained from triplicate experiments (a,b) or by a comparison to various independent reference data sets (c). The percentage of concordant CNV calls between replicates for each combination of array, algorithm and site (a). The corresponding average number of CNVs per sample is given in b. The results for the lower-resolution arrays can be found in Supplementary Figure 8. (c) The percentage of high-confidence CNV calls for each set of results that overlaps (minimum of 50% reciprocal overlap) with data from DGV, and references 11 and . The DGV data were divided into array-based CNVs and sequence-based CNVs, and for the reference 11 data we independently considered a set of 8,599 validated variants as well as a subset of 4,978 CNVs that were genotyped. The poor performance of the BAC array is explained by the fact that the DGV data set was filtered so that low-resolution studies (including BAC array data) were removed. Site abbreviations: see Table 1 legend.
Figure 3
Figure 3
Reproducibility of CNV breakpoint assignments. The distances between the breakpoints for replicated CNV calls were divided into size bins for each platform, and the proportion of CNVs in each bin are plotted separately for the start (red, left) and end (blue, right) coordinates. The total number of breakpoints is given in parentheses. The data show that high-resolution platforms are highly consistent in the assignment of start and end coordinates for CNVs called across replicate experiments. Affy, Affymetrix; BAC, bacterial artificial chromosome; brkpt, breakpoint; HMS, Harvard Medical School; Ilmn, Illumina; TCAG, The Centre for Applied Genomics; WTSI, Wellcome Trust Sanger Institute.
Figure 4
Figure 4
CNV breakpoint accuracy. (a,b) The breakpoint accuracy for CNV deletions on each platform was assessed in a comparison to published sequencing data sets of nucleotide-resolution breakpoints compiled from various studies, (a), or detected in the 1000 Genomes Project, (b). Only a subset of platforms is included in this figure, as the lower resolution arrays did not have enough overlapping variants to make the comparison meaningful. In b, a total of 3,544 deletion breakpoints for sample NA18517 were collected from the 1000 Genomes Project and compared to the CNVs detected in each of the analyses in this study. Every row in the diagram corresponds to one of the 3,544 deletions and the color indicates whether that deletion was detected in the present study. Each row represents the distance between array versus sequencing-based breakpoints (`left' + `right' breakpoints for the same event are listed in adjacent rows). Schematic below shows sample-based comparisons between deletion breakpoints obtained with array versus sequencing methods. Gray means the deletion was not detected, whereas a color on the red-green scale is indicative of the accuracy of detected breakpoints. 1000G, 1000 Genomes Project.

Similar articles

Cited by

References

    1. Iafrate AJ, et al. Detection of large-scale variation in the human genome. Nat. Genet. 2004;36:949–951. - PubMed
    1. Redon R, et al. Global variation in copy number in the human genome. Nature. 2006;444:444–454. - PMC - PubMed
    1. Sebat J, et al. Large-scale copy number polymorphism in the human genome. Science. 2004;305:525–528. - PubMed
    1. Tuzun E, et al. Fine-scale structural variation of the human genome. Nat. Genet. 2005;37:727–732. - PubMed
    1. Zhang J, Feuk L, Duggan GE, Khaja R, Scherer SW. Development of bioinformatics resources for display and analysis of copy number and other structural variants in the human genome. Cytogenet. Genome Res. 2006;115:205–214. - PubMed

Publication types

Associated data