. 2011 Jun;14(6):775-82.
doi: 10.1038/nn.2815. Epub 2011 May 8.

A normalization model of multisensory integration

Affiliations

A normalization model of multisensory integration

Tomokazu Ohshiro et al. Nat Neurosci. 2011 Jun.

Abstract

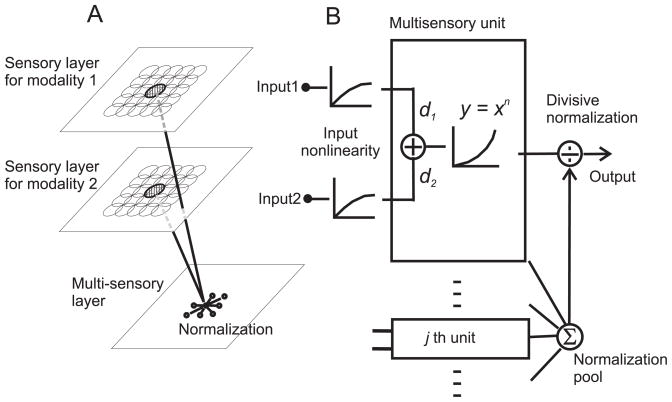
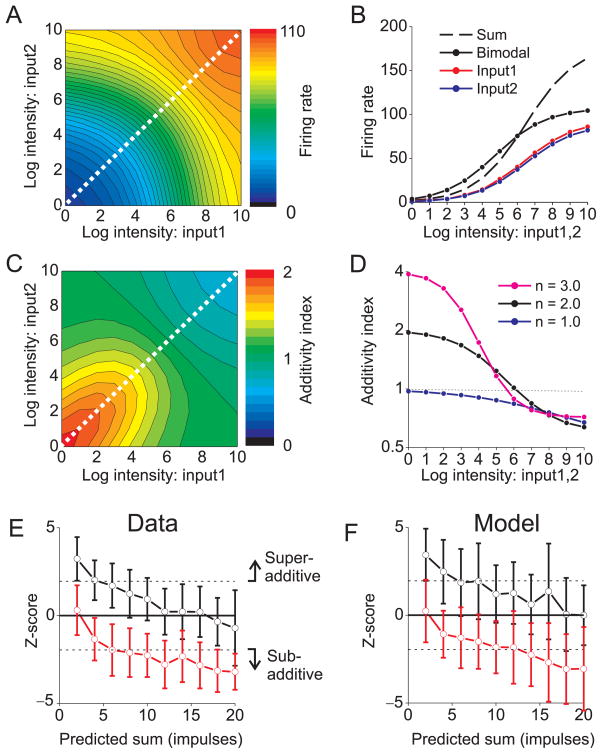
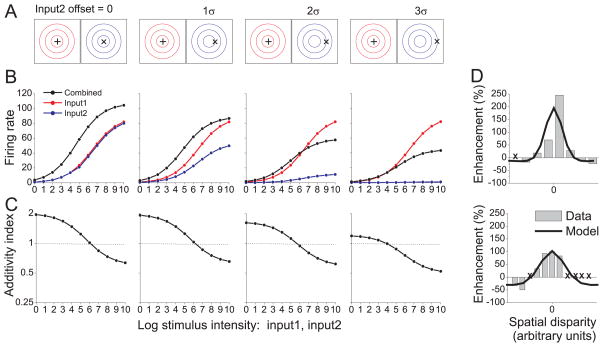
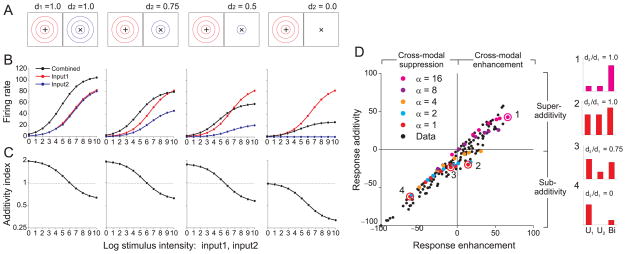
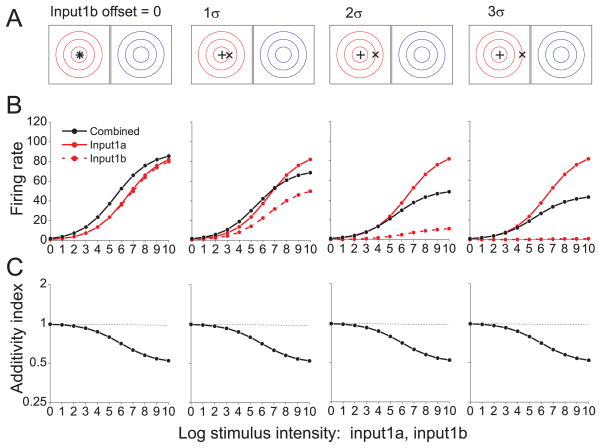
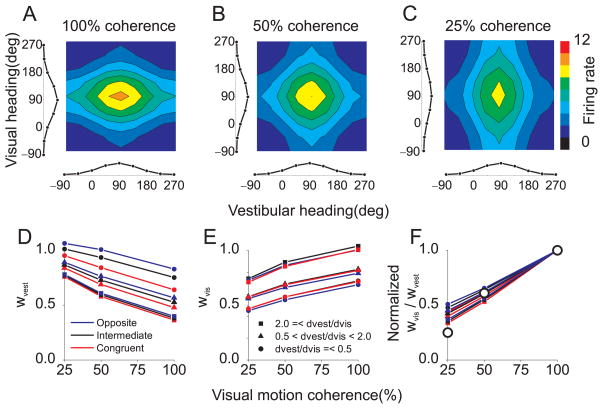
Responses of neurons that integrate multiple sensory inputs are traditionally characterized in terms of a set of empirical principles. However, a simple computational framework that accounts for these empirical features of multisensory integration has not been established. We propose that divisive normalization, acting at the stage of multisensory integration, can account for many of the empirical principles of multisensory integration shown by single neurons, such as the principle of inverse effectiveness and the spatial principle. This model, which uses a simple functional operation (normalization) for which there is considerable experimental support, also accounts for the recent observation that the mathematical rule by which multisensory neurons combine their inputs changes with cue reliability. The normalization model, which makes a strong testable prediction regarding cross-modal suppression, may therefore provide a simple unifying computational account of the important features of multisensory integration by neurons.


Figures

Figure 1
Figure 1
Schematic illustration of the normalization model of multisensory integration. (A) Overview of network architecture. The model consists of two layers of primary neurons that respond exclusively to sensory modalities 1 and 2. These primary sensory units feed into a layer of multisensory neurons that integrate responses from unisensory inputs with matched receptive fields. (B) Signal processing at the multisensory stage. Each unisensory input first passes through a nonlinearity that could represent synaptic depression or normalization within the unisensory pathways. The multisensory neuron then performs a weighted linear sum of its inputs with modality dominance weights, d1 and d2. Following an expansive power-law non-linearity that could represent the transformation from membrane potential to firing rate, the response is normalized by the net activity of all other multisensory neurons.
Figure 2
Figure 2. Normalization accounts for the principle of the inverse effectiveness
(A) The bimodal response of a model unit is plotted as a function of the intensities of Input1 and Input2. Both inputs were located in the center of the receptive field. Diagonal line: inputs with equal intensities. Exponent, n = 2.0. (B) The bimodal response (solid black curve) and the unimodal responses (red and blue curves) are plotted as a function of stimulus intensity (from the diagonal of panel A). The sum of the two unimodal responses is shown as the dashed black curve. Red and blue curves have slightly different amplitudes to improve clarity. (C) Additivity index (AI) is plotted as a function of both input intensities. AI > 1 indicates super-additivity, and AI < 1 indicates sub-additivity. (D) AI values (from the diagonal of panel C) are plotted as a function of intensity for three exponent values: n = 1.0 (blue), 2.0 (black), and 3.0 (magenta). (E) Data from cat superior colliculus, demonstrating inverse effectiveness (replotted from ref ). The z-scored bimodal response (± SD) is plotted against the predicted sum of the two unimodal responses, both for cross-modal (visual-auditory) inputs (black curve) or pairs of visual inputs (red). Z-score values >1.96 represent significant superadditivity, and values <−1.96 denote significant sub-additivity. (F) Model predictions match the data from cat superior colliculus. For this simulation, model neurons had all 9 combinations of dominance weights from the set (d1, d2 = 0.50, 0.75 or 1.00), and the exponent, n, was 1.5.
Figure 3
Figure 3. Normalization and the spatial principle of multisensory enhancement
(A) Schematic illustration of stimulus conditions used to simulate the spatial principle. Input 1 (‘+’ symbol) was located at the center of the receptive field for modality 1 (red contours). Input 2 (’×’ symbol) was offset by various amounts relative to the receptive field for modality 2 (blue contours). Contours defining each receptive field are separated by one standard deviation (σ of the Gaussian. The modality dominance weights were equal (d1 = d2 = 1). (B) Responses of the model neuron to the stimuli illustrated in panel A (format as in Fig. 2B). Response is plotted as a function of intensity for Input1 (red), Input2 (blue), and the bimodal stimulus (black). Critically, Input2 can be excitatory on its own (blue) but suppress the response to Input 1 (red) when the two are combined (black, 3rd column). (C) Additivity Index (AI) as a function of stimulus intensity. (D) Two examples of the spatial principle for neurons from cat superior colliculus, re-plotted from refs , . The response enhancement index (%) is plotted as a function of the spatial offset between visual and auditory stimuli (gray bars). Locations marked with an “X” denote missing data in the original data set. Predictions of the normalization model are shown as black curves. Model parameters (fit by hand) were: d1, d2 = 1.0, α =1.0 and n = 2.0. Stimulus intensity was set at 16 for the top neuron and 64 for the bottom neuron.
Figure 4
Figure 4. Multisensory suppression in “unisensory” neurons
(A) Responses were simulated for four model neurons. The dominance weight for modality 1, d1, was fixed at unity while the dominance weight for modality 2, d2, decreased from left to right (denoted by the number of receptive field contours). Input1 (‘+’) and Input2 (‘×’) were presented in the center of the receptive fields. (B) Responses as a function of intensity are shown for Input1 (red), Input2 (blue), and both inputs together (black). Format as in Fig. 3B. (C) Additivity Index is plotted as a function of intensity for the four model neurons; format as in Fig. 3C. (D) Summary of multisensory integration properties for a population of neurons from area VIP (black symbols), re-plotted from ref . The ordinate shows a measure of response additivity: (Bi – (U1 + U2)) / (Bi + (U1 + U2)) × 100, for which positive and negative values indicate superadditive and sub-additive interactions, respectively. Bi: bimodal response; U1, U2: unimodal responses. The abscissa represents a measure of response enhancement: (Bi – max (U1, U2)) / (Bi + max (U1, U2)) × 100, for which positive and negative values denote cross-modal enhancement and cross-modal suppression, respectively. Colored symbols represent predictions of the normalization model for units that vary in the ratio of dominance weights (d2/d1, ranging from 0 to 1) and the semi-saturation constant, α, ranging from 1 to 16. The exponent, n, was 2.5. Numbered symbols correspond to model neurons for which responses are shown as bar graphs (right).
Figure 5
Figure 5. Interactions among within-modality inputs
(A) The stimulus configuration was similar to that of Fig. 3A except that two stimuli of the same sensory modality, Input1a (‘+’) and Input1b (‘×’) were presented, and one was systematically offset relative to the receptive field of modality 1 (red contours). No stimulus was presented to the receptive field of modality 2 (blue contours) (B) Responses of a model neuron are shown for Input1a alone (solid red curve), Input1b alone (dashed red curve) and both inputs together (black curve). (C) Additivity Index as a function of stimulus intensity shows that model responses to pairs of within-modality inputs are additive or sub-additive with no super-additivity.
Figure 6
Figure 6. Normalization accounts for apparent changes in the multisensory combination rule with cue reliability
(A) Responses of a model MSTd neuron to visual and vestibular heading stimuli (100% visual motion coherence). The bimodal response, Rbimodal (ϕvest,ϕvis), to many combinations of visual (ϕvis) and vestibular (ϕvest) headings is shown as a color contour plot. Curves along the bottom and left margins represent unimodal responses, Rvest (ϕvest) and Rvis(ϕvis). This model neuron prefers forward motion (90°). (B) Reponses of the same model neuron when visual stimulus intensity is reduced to 50% coherence. (C) Responses to 25% coherence. Vestibular stimulus amplitude is constant in panels A–C at the equivalent of 50% coherence. (D) Bimodal responses were fit with a weighted linear sum of unimodal responses. This panel shows the vestibular mixing weight, wvest, as a function of motion coherence. Red, blue and black points denote model neurons with congruent, opposite and intermediate visual and vestibular heading preferences, respectively. Different symbol shapes denote groups of neurons with different ratios of modality dominance weights: dvest/dvis <= 0.5, 0.5 < dvest/dvis < 2.0, or 2.0 <= dvest/dvis. Note that wvest decreases with coherence. (E) The visual mixing weight, wvis, increases with coherence. Format as in panel D (F) The ratio of vestibular and visual mixing weights, wvis/wvest, normalized to unity at 100% coherence, is plotted as a function of motion coherence. Model predictions are qualitatively consistent with data from area MSTd, replotted from ref as large open symbols.

Comment in

References

    1. Alais D, Burr D. The ventriloquist effect results from near-optimal bimodal integration. Curr Biol. 2004;14:257–262. - PubMed
    1. Ernst MO, Banks MS. Humans integrate visual and haptic information in a statistically optimal fashion. Nature. 2002;415:429–433. - PubMed
    1. Fetsch CR, Turner AH, DeAngelis GC, Angelaki DE. Dynamic reweighting of visual and vestibular cues during self-motion perception. J Neurosci. 2009;29:15601–15612. - PMC - PubMed
    1. Stein BE, Stanford TR. Multisensory integration: current issues from the perspective of the single neuron. Nat Rev Neurosci. 2008;9:255–266. - PubMed
    1. Meredith MA, Stein BE. Visual, auditory, and somatosensory convergence on cells in superior colliculus results in multisensory integration. J Neurophysiol. 1986;56:640–662. - PubMed

Publication types