. 2011 Jun;14(6):783-90.
doi: 10.1038/nn.2814. Epub 2011 May 8.

Behavior and neural basis of near-optimal visual search

Affiliations

Behavior and neural basis of near-optimal visual search

Wei Ji Ma et al. Nat Neurosci. 2011 Jun.

Abstract

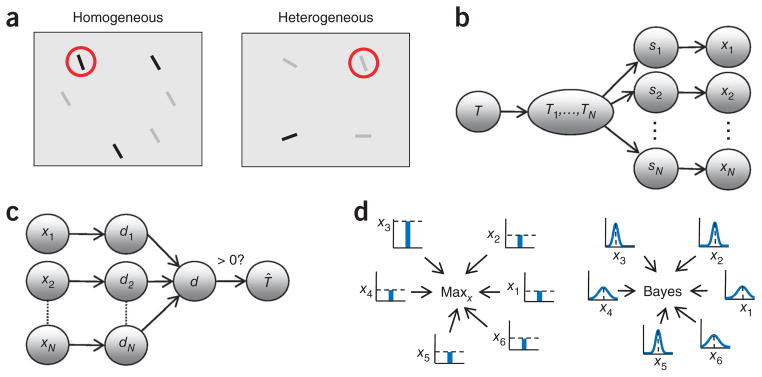
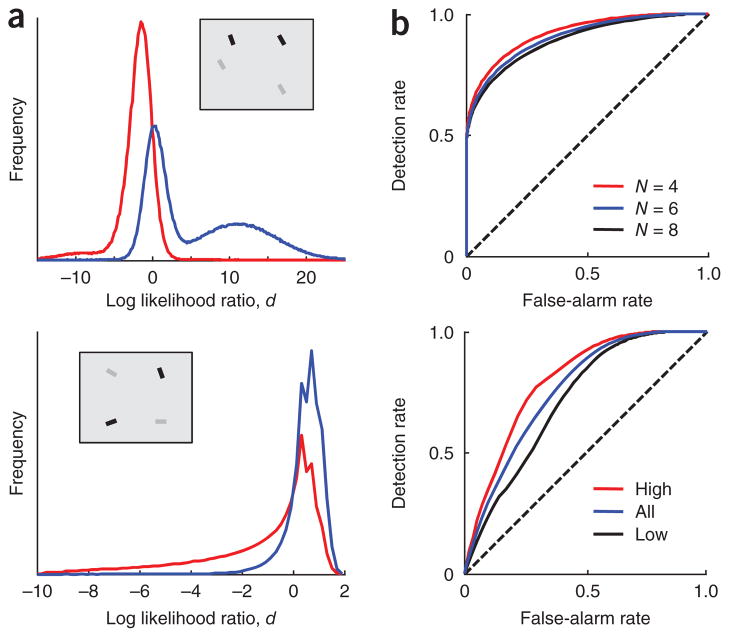
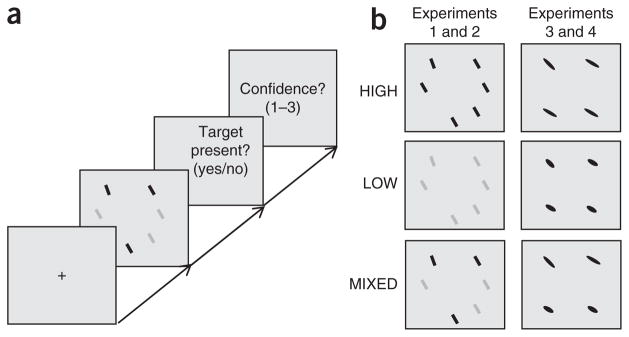
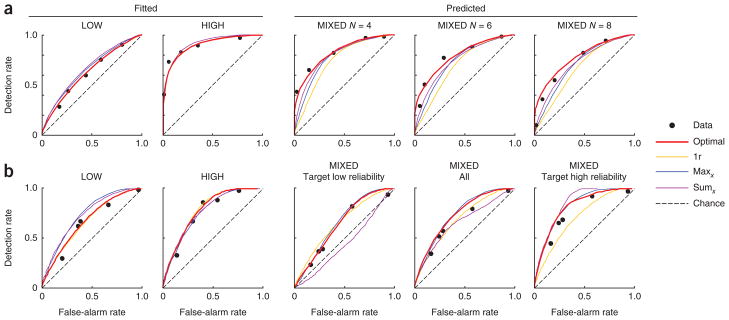
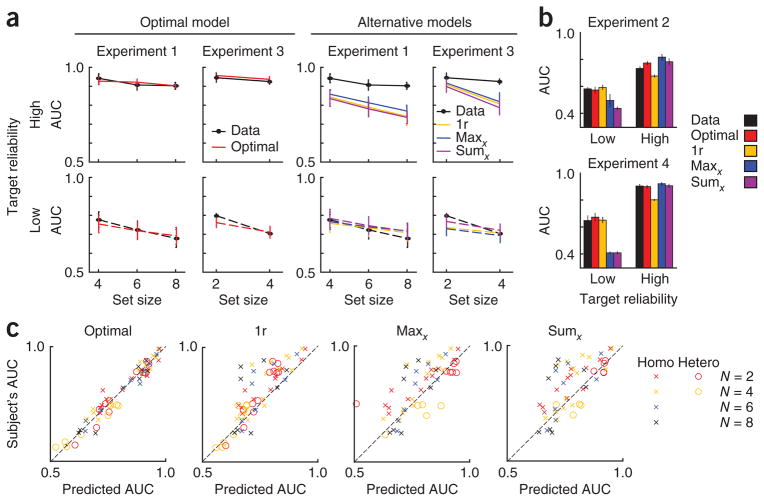
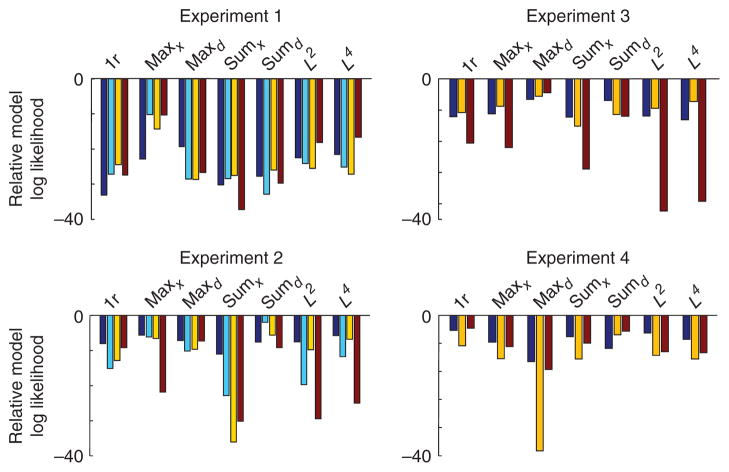
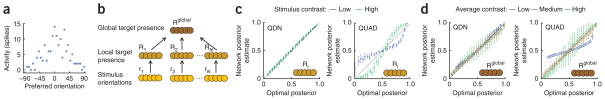
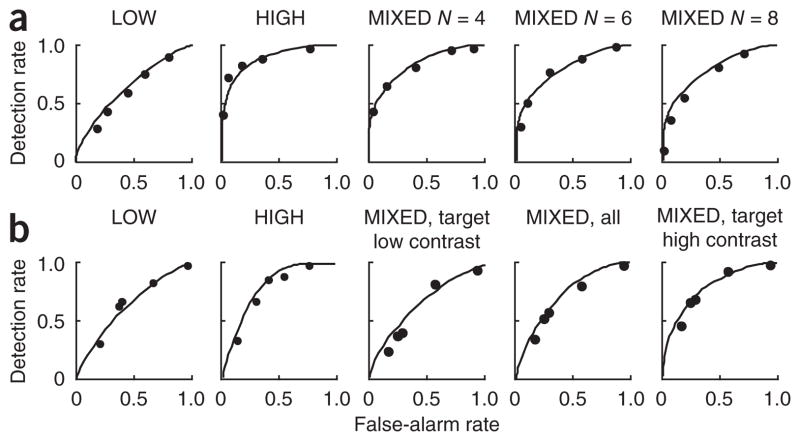
The ability to search efficiently for a target in a cluttered environment is one of the most remarkable functions of the nervous system. This task is difficult under natural circumstances, as the reliability of sensory information can vary greatly across space and time and is typically a priori unknown to the observer. In contrast, visual-search experiments commonly use stimuli of equal and known reliability. In a target detection task, we randomly assigned high or low reliability to each item on a trial-by-trial basis. An optimal observer would weight the observations by their trial-to-trial reliability and combine them using a specific nonlinear integration rule. We found that humans were near-optimal, regardless of whether distractors were homogeneous or heterogeneous and whether reliability was manipulated through contrast or shape. We present a neural-network implementation of near-optimal visual search based on probabilistic population coding. The network matched human performance.


Conflict of interest statement

COMPETING FINANCIAL INTERESTS

The authors declare no competing financial interests.

Figures

Figure 1
Figure 1
Reliability and inference in visual search. (a) Search under unequal reliabilities. Stimulus reliability is controlled by contrast, but the target (red circle) is defined only by orientation. Left, homogeneous distractors. Right, heterogeneous distractors. (b) Statistical structure of the task (generative model). Arrows indicate conditional dependencies. T, global target presence; Ti, local target presence; si, stimulus orientation; xi, noisy observation. In the neural formulation, xi is replaced by a pattern of neural activity, ri. (c) The optimal decision process for inferring target presence inverts the generative model. di, local log likelihood ratio of target presence; d, global log likelihood ratio. The sign of d determines the decision and its absolute value reflects confidence. (d) Left, maxx model applied to a homogeneous-distractor display as in a. At each location, an orientation detector produces a response xi (bar plots) that is variable, but is on average higher for the target than for a distractor. The decision is based on the largest detector response. Stimulus reliability is ignored. Right, optimal decision process for the same display. At each location, a likelihood function over orientation is encoded (small plots), reflecting not only the most likely orientation xi (mode) but also its uncertainty (width).
Figure 2
Figure 2
Optimal search under unequal reliabilities. (a) Theoretical distribution of the global log likelihood ratio, d, across 106 trials at N = 4, in target-absent displays (red) and target-present displays (blue). Insets show example displays. Top, homogeneous distractors, with target and distractor orientations 10° apart. Internal representations xi were drawn from normal distributions with s.d. σi equal to 2° or 6°. Bimodality arises from the fact that a stimulus can have low or high reliability. Bottom, heterogeneous distractors. Stimulus orientations si were drawn from a uniform distribution and their internal representations xi were drawn from Von Mises distributions with concentration parameters κi equal to 5 or 10. Bimodality arises because the cosine of a uniformly distributed angle is bimodally distributed. (b) ROC curves of the optimal observer. Top, homogeneous distractors at N = 4,6,8. Bottom, heterogeneous distractors at N = 4, unconditioned (blue) or conditioned on the target having high (red) or low (black) reliability. Parameters are as in a. Nonconcavity arises from conditioning on target reliability.
Figure 3
Figure 3
Experimental procedure. (a) Subjects report through a key press whether a predefined target is present in the display, then rate their confidence on a scale from 1 to 3. (b) Experimental conditions. Items in a single display can be all high-reliability (HIGH), all low-reliability (LOW), or a combination of both reliabilities (MIXED). Stimulus reliability was manipulated through contrast in Experiments 1 and 2 (left), and through ellipse eccentricity in Experiments 3 and 4 (right). Example displays show homogeneous distractors; the procedure was identical for heterogeneous distractors.
Figure 4
Figure 4
Model predictions for individual-subject receiver operating characteristics. Dots indicate empirical ROC curves. Solid lines show fits (in LOW and HIGH) and predictions (in MIXED) of four models. Stimuli were bars and reliability was manipulated through contrast. (a) Experiment 1 (homogeneous distractors), subject S.N. MIXED trials are grouped by set size. 1r, single-reliability model. (b) Experiment 2 (heterogeneous distractors), subject V.N. MIXED trials are grouped by target reliability. The below-chance ROC curve in the third panel is a result of conditioning on target reliability. Maxd, sumd, L2 and L4 model ROC curves are presented as in Supplementary Figures 1–4, along with the ROC curves from other subjects and experiments 3 and 4.
Figure 5
Figure 5
Model predictions for area under the ROC curve (AUC) in the mixed-reliability condition. For models not shown here, see Supplementary Figures 7 and 10. (a) Data (black), and model predictions obtained from maximum-likelihood estimation in HIGH and LOW (colored lines), in experiments 1 and 3 (homogeneous distractors). Target reliability is high (solid) or low (dashed). (b) Data are presented as in a for experiments 2 and 4 (heterogeneous distractors). Set size was 4 in experiment 2 and 2 in experiment 4. Error bars represent s.e.m. (c) Scatter plot of actual versus predicted AUC for models and individual subjects across all experiments (1 to 4, and auxiliary experiments 1a and 2a; see Supplementary Results). Conditioning on target reliability produces two points per subject.
Figure 6
Figure 6
Log likelihood of nonoptimal models relative to the optimal model for individual subjects. Subjects are labeled by color, separately for each experiment. Negative numbers indicate that the optimal model fits the human data better.
Figure 7
Figure 7
Neural implementation of near-optimal visual search. (a) Example population pattern of activity encoding orientation at one location. Neurons are ordered by their preferred orientation. (b) Network architecture. (c) Posterior probability of local target presence encoded in the second layer versus the optimal posterior probability, when distractors are heterogeneous. Color indicates stimulus contrast. Left, QDN network. Right, QUAD network. Results for other networks and homogeneous distractors are shown in Supplementary Figures 12 and 13. (d) Posterior probability of global target presence encoded in the third layer versus the optimal posterior probability. Left, QDN network. Right, QUAD network. Color indicates the average contrast in the display; across all displays, the histogram of contrasts was binned into low, medium and high. Results for other networks are shown in Supplementary Figure 14. Error bars represent s.d.
Figure 8
Figure 8
Neural network reproduces human search performance. ROC curves of the same human observers as in Figure 4 (dots) and the best-fitting QDN network (line). (a) Homogeneous distractors (experiment 1). (b) Heterogeneous distractors (experiment 2).

Similar articles

Cited by

References

    1. Palmer J, Ames CT, Lindsey DT. Measuring the effect of attention on simple visual search. J Exp Psychol Hum Percept Perform. 1993;19:108–130. - PubMed
    1. Treisman AM, Gelade G. A feature-integration theory of attention. Cognit Psychol. 1980;12:97–136. - PubMed
    1. Estes WD, Taylor RM. A detection method and probabilistic models for assessing information processing from brief visual displays. Proc Natl Acad Sci USA. 1964;52:446–454. - PMC - PubMed
    1. Shaw ML. Identifying attentional and decision-making components in information processing. In: Nickerson RS, editor. Attention and Performance. Erlbaum; Hillsdale, New Jersey: 1980. pp. 277–296.
    1. Teichner WH, Krebs MJ. Visual search for simple targets. Psychol Bull. 1974;81:15–28. - PubMed

Publication types