. 2011 Oct 27;30(43):4386-98.
doi: 10.1038/onc.2011.148. Epub 2011 May 9.

miR-135a contributes to paclitaxel resistance in tumor cells both in vitro and in vivo

Affiliations

miR-135a contributes to paclitaxel resistance in tumor cells both in vitro and in vivo

A Holleman et al. Oncogene. .

Abstract

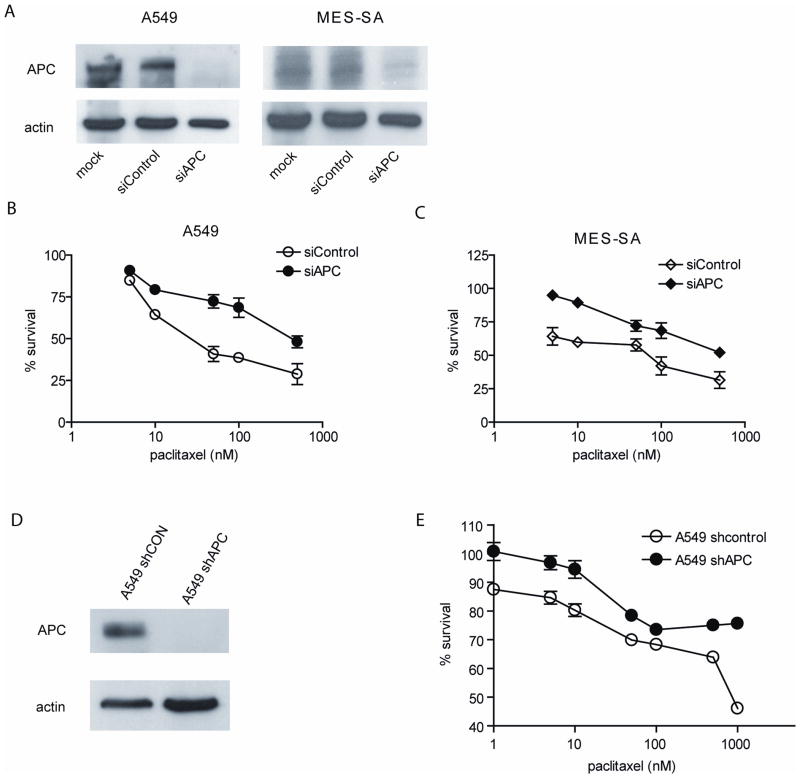
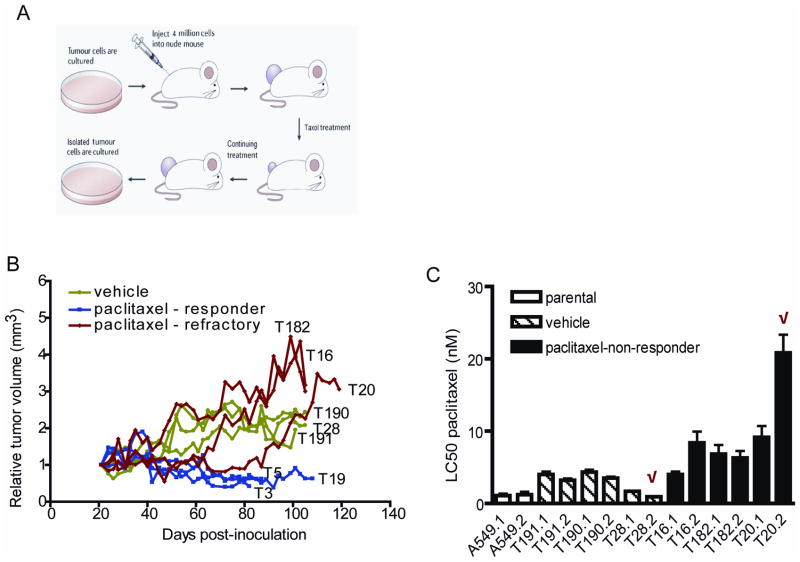
Cancer cell resistance to paclitaxel continues to be a major clinical problem. In this study, we utilized microRNA (miRNA) arrays to screen for differentially expressed miRNAs in paclitaxel-resistant cell lines established in vitro. We observed concordant upregulation of miR-135a in paclitaxel-resistant cell lines representing three human malignancies. Subsequently, the role of miRNA-135a was evaluated in an in vivo model of paclitaxel resistance. In this model, mice were inoculated subcutaneously with a non-small cell lung carcinoma cell line and treated with paclitaxel for a prolonged period. In paclitaxel-resistant cell lines, established either in vitro or in vivo, blockage of miR-135a sensitized resistant cell lines to paclitaxel-induced cell death. We further demonstrated a correlation between paclitaxel response and miR-135a expression in paclitaxel-resistant subclones that were established in vivo. The paclitaxel-resistant phenotype of these subclones was maintained upon retransplantation in new mice, as shown by decreased tumor response upon paclitaxel treatment compared with controls. Upregulation of miR-135a was associated with reduced expression of the adenomatous polyposis coli gene (APC). APC knockdown increased paclitaxel resistance in parental cell lines. Our results indicate that paclitaxel resistance is associated with upregulation of miR-135a, both in vitro and in vivo, and is in part determined by miR-135a-mediated downregulation of APC.


Conflict of interest statement

Conflict of interest

The authors declare no conflict of interest.

Figures

Figure 1
Figure 1. miRNA array of 4 paclitaxel-resistant cell lines
Supervised hierarchical clustering of cell lines based on expression of miRNAs with ΔLMR≥2 in at least one cell line. Each column represents a cell line and each row a probe set. The heat maps indicate high (red) or low (blue) level of expression relative to the mean as per the scale shown.
Figure 2
Figure 2. Upregulation of miR-135a in a panel of paclitaxel-resistant cancer cell lines
Real-time PCR analysis of miR-135a expression in parental MES-SA, SKOV, A549 and PC-14 cells (gray bars) compared to the expression of their paclitaxel-resistant subclones (black bars). Bars represent mean and % s.e.m. from triplicate experiments. *: P<0.05, **: P<0.001 as determined by Wilcoxon’s rank sum test.
Figure 3
Figure 3. miR-135a is functionally involved in the paclitaxel response of cancer cell lines
The paclitaxel-resistant cell lines MES-SADX5 and A549TR were transfected with a scrambled non-targeting miRNA (control) and a miR-135a inhibitor (inhibitor) and the paclitaxel-sensitive parental MES-SA and A549 cells with a scrambled non-targeting miRNA (control) and a miR-135a mimic (mimic). Cells were subsequently treated with 100 nM paclitaxel and cell viability was assessed using the MTT assay (A–B). The % of apoptotic cells was assessed by Annexin V-staining and FACS analysis (C–D). Values are presented as % cell survival in paclitaxel-treated cells relative to untreated cells. *: P<0.05, **: P<0.001 as determined by Wilcoxon’s rank sum test.
Figure 4
Figure 4. miR-135a modulates APC expression in paclitaxel-resistant cancer cells
MES-SA (A) or A549 (B) cells were transfected with a luciferase reporter construct fused to APC 3 ′UTR or a control luciferase reporter vector with a random 3 ′UTR (random UTR). Subsequently, cells were cotransfected with either a miR-135a mimic or a non-targeting miRNA control (control miR). Values are shown as the percent of luciferase expression compared to the control. (C) Endogenous APC mRNA expression was quantified by real-time PCR analysis in A549, A549TR, MES-SA and MES-SADX5 cells. Bars represent mean and s.e.m. from duplicate experiments. NS: not significant, **: P<0.001 as determined by Wilcoxon’s rank sum test. In addition, APC protein expression was examined by western blotting (bottom panel). (D) A549TR cells were transfected with scrambled non-targeting miRNA (control) or miR-135a inhibitor. At the indicated time points, APC mRNA expression was examined by real-time quantitative PCR. (E) A549TR cells were mock-transfected, transfected with a scrambled miRNA (control inhibitor) or with a miR-135a inhibitor. Cells were fixed with paraformaldehyde, permeabilized and stained with APC-specific polyclonal antibodies, followed by fluorophore-conjugated secondary antibodies; nuclei were stained with DAPI. In addition, cells were lysed and APC protein levels were examined by western blot (bottom panel).
Figure 5
Figure 5. miR-135a-mediated APC suppression contributes to paclitaxel resistance
MES-SA and A549 cells were mock-transfected (mock), transfected with a scrambled siRNA (siControl) or with siRNA directed against APC (siAPC). APC expression was examined by immunoblotting (A). Transfected MES-SA (B) and A549 (C) cells were treated with paclitaxel and viability was assessed using the MTT assay. Values are presented as percentage of cell survival in paclitaxel-treated cells relative to untreated cells. A549 cells stably expressing either non-targeting shRNA (shCON) or shRNA against APC (shAPC) were generated. (D) Western blot analysis shows the expression level of APC in both cells. (E) Both A549-shCON and -shAPC cells were treated with paclitaxel and cell viability was measured using the MTT assay. Values are presented as percentage of cell survival in paclitaxel-treated cells relative to untreated cells.
Figure 6
Figure 6. Establishment of A549 paclitaxel-resistant cells in vivo
(A) A suspension of A549 cells was injected subcutaneously into the flank of a nude mouse. When the average tumor volume was at least 120 mm3, vehicle or paclitaxel (15 mg/kg) was administered i.p. every other day. Treatment was continued until tumors reached approximately four times their initial volume. Paclitaxel-refractory as well as vehicle-treated tumors were digested with collagenase and cultured in vitro. (B) Tumor growth was determined as the tumor volume on the day of treatment relative to the tumor volume at the start of treatment and presented as a ratio. Tumors treated with vehicle are shown in green, tumors responsive to paclitaxel in blue and tumors with continuous growth in the presence of paclitaxel in red. Each line represents the growth of an individual tumor (T) in an individual mouse (indicated by a number). Curves for representative tumors per group are shown. (C) Vehicle-treated tumors (hatched bars) or paclitaxel-refractory tumors (black bars) were harvested from mice and used to generate two cell lines per tumor. The indicated cell lines were cultured in vitro and cell viability was assessed 72 h after paclitaxel addition using the MTT assay. Bars represent average LC50 ± s.e.m. from triplicate experiments. The most resistant and sensitive cell lines in vitro, indicated with a red checkmark, were selected for reinjection.
Figure 7
Figure 7. Establishment of an A549 in vivo paclitaxel resistance model: retransplantation
(A) Tumor cell lines established after an initial round of inoculation and treatment with either vehicle (blue lines, T28.2) or 15 mg/kg paclitaxel (red lines, T20.2) were harvested during log-phase growth and reinjected subcutaneously into the flanks of nude mice. When the average tumor volume was ~120 mm3, vehicle (open circles or squares) or 15 mg/kg paclitaxel (closed circles or squares) was administered i.p. every other day. Treatment was continued until tumors reached approximately four times their initial volume. Each curve represents the average tumor growth ± s.e.m. for 10 mice per group. (B) Relative tumor burden at the end of the experiment. Each bar represents the average tumor growth ± s.e.m. for 10 mice per group. NS: not significant, *: P<0.05 as determined by Wilcoxon’s rank sum test. (C) Tumors were harvested, cultured in vitro and cell viability was assessed using the MTT assay. Values are presented as percentage of cell survival in paclitaxel-treated cells relative to untreated cells. White bars represent LC50s from tumor cell lines established from T28.2 tumors treated with vehicle. Black bars represent LC50s from cell lines established from T20.2 tumors treated with paclitaxel. Shown are the mean ± s.e.m. of two independent experiments, each performed in triplicate. *:P<0.05 as determined by Wilcoxon’s rank sum test.
Figure 8
Figure 8. miR-135a plays a role in in vivo paclitaxel resistance
(A). The parental A549 cells, a cell line that became refractory during in vivo treatment with paclitaxel (T20.2 round 1) and the same cell line established after yet another round of in vivo paclitaxel treatment (T20.2 reinjection) were treated with paclitaxel and cell viability was assessed using the MTT assay. Represented are average LC50 ± s.e.m. determined by MTT assay for parental A549 cells (white boxes), **:P<0.001, *: P<0.05 as determined by Wilcoxon’s rank sum test for T20.2 round 1 cells (hatched boxes) and for T20.2 re-injection cells (filled boxes). (B) The expression of miR-135a was examined in these cells by real-time quantitative PCR. *: P<0.05 as determined by Wilcoxon’s rank sum test. (C) The expression of miR-135a was examined in the cell lines established in vivo. The correlation between paclitaxel response and miR-135a expression was calculated using the Spearman’s rank test. (D–E) The paclitaxel-resistant cell line T800.1 (D) or the paclitaxel-sensitive T824.1 cell line (E) established after two rounds of treatment with vehicle were transfected with a scrambled non-targeting miRNA (control), a miR-135a inhibitor (inhibitor) in the resistant cells or a miR-135a mimic (mimic) in the sensitive cells. Subsequently, cells were treated with the indicated concentrations of paclitaxel and cell viability was assessed using the MTT assay. Values are presented as percentage of cell survival in paclitaxel-treated cells relative to untreated cells. Shown are the mean and s.e.m. of two independent experiments, each performed in triplicate.
Figure 9
Figure 9. Overexpression of miR-135a confers paclitaxel resistance in A549 cells in vivo
A549 cells stably expressing either non-targeting premiR (A549-control) or premiR-135a (A549-miR-135a) were generated. (A) miR-135a expression level in A549-control and -miR-135a was determined and compared with A549 and A549TR cells using quantitative real time PCR analysis. *: P<0.01. (B) Paclitaxel response of A549-control and A549-premiR-135a cells was determined using the MTT assay. (C) APC protein expression was examined using Western blot analysis in A549-control and -premiR-135a cells. (D) A549-control and -premiR-135a cells were inoculated subcutaneously into the flanks of nude mice. Paclitaxel treatment was given three times a week for three weeks. The tumor size in each group was measured during the course of treatment and was calculated relative to the size prior to treatment initiation. Each curve represents the average tumor growth ± s.e.m. for 10 mice per group. *: P<0.05, **: P<0.001 as determined by Wilcoxon’s rank sum test.

Similar articles

Cited by

References

    1. Anand S, Penrhyn-Lowe S, Venkitaraman AR. AURORA-A amplification overrides the mitotic spindle assembly checkpoint, inducing resistance to Taxol. Cancer Cell. 2003;3:51–62. - PubMed
    1. Aoki K, Taketo MM. Adenomatous polyposis coli (APC): a multi-functional tumor suppressor gene. J Cell Sci. 2007;120:3327–35. - PubMed
    1. Blower PE, Verducci JS, Lin S, Zhou J, Chung JH, Dai Z, et al. MicroRNA expression profiles for the NCI-60 cancer cell panel. Mol Cancer Ther. 2007;6:1483–91. - PubMed
    1. Chu Q, Vincent M, Logan D, Mackay JA, Evans WK. Taxanes as first-line therapy for advanced non-small cell lung cancer: a systematic review and practice guideline. Lung Cancer. 2005;50:355–74. - PubMed
    1. Cleveland WS. Robust locally weighted regression and smoothing scatter plots. J Amer Statist Assoc. 1979;74:829–836.

Publication types