. 2011 Oct 13;30(41):4243-60.
doi: 10.1038/onc.2011.133. Epub 2011 May 9.

Dysregulated TRK signalling is a therapeutic target in CYLD defective tumours

Affiliations

Dysregulated TRK signalling is a therapeutic target in CYLD defective tumours

N Rajan et al. Oncogene. .

Abstract

Individuals with germline mutations in the tumour-suppressor gene CYLD are at high risk of developing disfiguring cutaneous appendageal tumours, the defining tumour being the highly organised cylindroma. Here, we analysed CYLD mutant tumour genomes by array comparative genomic hybridisation and gene expression microarray analysis. CYLD mutant tumours were characterised by an absence of copy-number aberrations apart from LOH chromosome 16q, the genomic location of the CYLD gene. Gene expression profiling of CYLD mutant tumours showed dysregulated tropomyosin kinase (TRK) signalling, with overexpression of TRKB and TRKC in tumours when compared with perilesional skin. Immunohistochemical analysis of a tumour microarray showed strong membranous TRKB and TRKC staining in cylindromas, as well as elevated levels of ERK phosphorylation and BCL2 expression. Membranous TRKC overexpression was also observed in 70% of sporadic BCCs. RNA interference-mediated silencing of TRKB and TRKC, as well as treatment with the small-molecule TRK inhibitor lestaurtinib, reduced colony formation and proliferation in 3D primary cell cultures established from CYLD mutant tumours. These results suggest that TRK inhibition could be used as a strategy to treat tumours with loss of functional CYLD.


Figures

Figure 1
Figure 1. Cylindroma and spiradenomas tumours are genomically similar and show stability.
(a) Genomic DNA was extracted from 7 cylindroma and 5 spiradenoma microdissected tumours and competitively hybridised against patient matched peripheral lymphocyte DNA on a 32K BAC tiling path array. No significant copy number change was seen between tumours and perilesional skin; an indicative result is shown. (b) To examine for genomic changes at higher resolution, single nucleotide polymorphism (SNP) typing was performed using a 550K SNP array in a further 4 cylindromas. LOH was seen across the entire arm of chromosome 16q in all 4 samples, indicated by the red arrow. In (a), circular binary segmentation (cbs)-smoothed Log2 ratios are plotted on the Y axis against each bacterial artificial chromosome (BAC) clone according to genomic location on the X axis. BACs categorised as displaying genomic gains or amplification are plotted in green and those categorised as genomic losses in red.
Figure 2
Figure 2. Cylindromas and spiradenomas share similar transcriptomes, and cluster distinctly from trichoepitheliomas and perilesional control skin.
Total RNA was extracted from 32 microdissected tumours and 10 perilesional controls and gene expression levels of 24526 transcripts for each sample were assayed. Unsupervised clustering of the 42 transcriptomes was performed, and cylindromas and spiradenomas clustered together, with trichoepitheliomas and perilesional skin clustering separately. No clustering by gender, genotype or tumour location was seen.
Figure 3
Figure 3. NFκB target genes are overexpressed in CYLD mutant tumours.
Expression levels of 24526 genes from 32 microdissected tumours were pooled and compared against 10 pooled perilesional controls and subject to gene set expression analysis. Sets of genes recognised to modulate apoptosis were found to be overexpressed in the tumour tissue (see also Supplementary figure 1). A heat map of the members of one set (HSA04210_APOPTOSIS) is shown here, with overexpressed genes shown in red and underexpressed genes in blue. Overexpressed genes included several NFκB target genes.
Figure 4
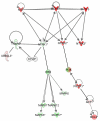
Figure 4. TRK signalling is dysregulated in cylindroma and spiradenoma tissue.
Expression levels of 24526 genes from 32 microdissected tumours were pooled and compared against 10 pooled perilesional controls, and genes that were differentially expressed (p value <0.01) were analysed using Ingenuity pathway analysis. Overexpressed transcripts are shown in red and underexpressed transcripts are shown in green. TRKB (NTRK2) and TRKC (NTRK3), members of the TRK signalling pathway, were overexpressed in tumour tissue compared to control samples. Expression of TRKA (NTRK1) however was reduced. Downstream members such as PI3K and AKT and BCL2 were also over expressed.
Figure 5
Figure 5. TRKB and TRKC proteins are over expressed in human cylindromas and spiradenomas.
(a) Tissue microarrays of cylindromas and spiradenomas were probed with antibodies as indicated, and visualised using a horseradish peroxidase – diaminobenzene system, with haematoxylin used as a nuclear counterstain. Membranous TRKB and TRKC were overexpressed in the tumours, exemplified by the cylindroma tumours illustrated here. Patchy perinuclear TRKA staining was seen in some tumour cells. Expression of downstream targets phosphoERK and BCL2 was also seen. Scale bars indicate 100μm; insets are shown to demonstrate specific membranous staining of TRKB and TRKC (2x enlargement of related image). (b-c) Membranous immunostaining scores of TRKC and TRKB were made on all cores on the array, with p-values of the difference in score (t-test) between tumour and control indicated in Table 3. Error bars indicate standard error of the mean.
Figure 6
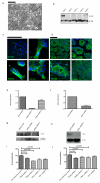
Figure 6. TRKB and TRKC knockdown reduces primary cell culture colony formation
(a) Cylindroma tumour tissue was enzymatically digested and converted to a single cell suspension, and grown on collagen coated tissue culture plastic. (b) Total cell lysates from control HeLa cells, three cylindroma primary cell cultures and a matched patient fibroblast culture were subject to SDS-PAGE, and probed with anti-CYLD antibodies. Lack of full length CYLD is seen in primary cell cultures. (c) Cylindroma primary cell cultures and tissue were fixed and probed with antibodies against the cytokeratins indicated and labelled with fluorescent secondary antibodies for visualization; DAPI was used as a nuclear counterstain. CYLD expression is not seen in primary cell culture. Cylindroma primary cell culture cells expressed cytokeratins that are seen (d) in cylindroma tumours. (e-f) Cylindroma cells were subject to lentiviral mediated short hairpin RNA knockdown of TRKB, TRKC and these were compared against a control hairpin. Knockdown was assessed at the protein level using immunoblotting. (g-h) Transcript expression of TRKB and TRKC is reduced following lentiviral knockdown. (i) Following puromycin selection, GFP positive cells were plated and grown over 12 days. TRKB and TRKC knockdown resulted in reduced colony formation. (j) Similar results were seen in a short-term cell viability assay. All experiments were repeated at least three times. Error bars indicate standard error of the mean and scale bars represent a distance of 100μm.
Figure 7
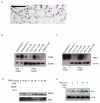
Figure 7. Three-dimensional primary cell culture of cylindroma cells express TRK proteins and respond to stimulation with cognate TRK ligands
(a) Cylindroma primary cell cultures were plated onto collagen coated tissue culture scaffolds (3D cell culture) and grown for 28 days in the same conditions as standard 2D cell culture. Tissue culture scaffolds were fixed and stained with haematoxylin and eosin (20x original magnification expression – scale bar 100μm) (b-c) Total cell lysates from fresh tumours, 3D and 2D cell cultures were separated using SDS-PAGE, and immunoblots were probed using (b) TRKB and (c) TRKC antibodies. Lanes 1 and 2 were loaded with 5μg of cell lysate from fresh tumours, labelled “Cylindroma 1 and 2”, rest 20μg of lysate from primary cell cultures in 3D (PCC 2,4 3D) and cultures in 2D (PCC 2,4 2D). TRKB and TRKC were expressed at higher levels in 3D cell cultures (Lanes 3 and 5) compared to matched 2D cultures (Lanes 4 and 6). (d-e) Cylindroma cells grown on 3D scaffolds and stimulated with NGF, BDNF and NT3 for the periods indicated, and then transferred to ice cold PBS, and cell lysates were extracted for immunoblotting. Membranes were probed with antibodies to phosphorylated ERK and BCL2. Increased levels of phosphoERK and BCL2 were seen. All experiments were repeated at least three times.
Figure 8
Figure 8. Cylindroma 3D primary cell cultures demonstrate an increased sensitivity to TRK inhibitors relative to aspirin.
(a-d) Cylindroma 3D cell cultures were grown for two weeks in the presence of salicylic acid, K252a, Tyrphostin AG879 and lestaurtinib (CEP-701) in triplicate in a 96 well format. This was repeated using at least three different tumours, from different body sites in three patients. Cell viability was assessed using a luminescent cell viability assay at the end of this period and dose response curves were generated. Cylindroma cells were sensitive to lestaurtinib at micromolar levels, whilst salicylic acid had a similar effect at milimolar levels.
Figure 9
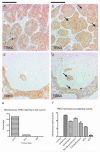
Figure 9. Membranous TRKC is overexpressed in basal cell carcinoma.
A skin cancer tumour microarray with 23 BCCs, 19 SCCs and 5 malignant melanomas with two cores per case was immunostained with antibodies against TRKA, TRKB and TRKC. (a) Strong circumferential membranous immunostaining of TRKC is seen in 16 out of 23 cases (70%) of basal cell carcinoma on a tissue microarray, whilst there is an absence of membranous TRKA and TRKB staining. (b) One squamous cell carcinoma demonstrated a similar pattern of staining. Malignant melanomas did not display membranous staining. (c-d) 39% of BCC and 16% of SCC also demonstrated perinuclear TRKA staining, and 13% of BCCs only demonstrated faint cytoplasmic TRKB staining. (e) Percentage of cases with membranous TRKC staining. (f) Mean membranous staining scores for TRKC were performed. Membranous TRKC staining is seen in 70% of BCC in this series, 5% of SCC, but not in malignant melanoma. The error bars indicate the standard error of the mean.

Similar articles

Cited by

References

    1. Adly MA, Assaf HA, Nada EA, Soliman M, Hussein M. Human scalp skin and hair follicles express neurotrophin-3 and its high-affinity receptor tyrosine kinase C, and show hair cycle-dependent alterations in expression. Br J Dermatol. 2005;153:514–20. - PubMed
    1. Alvarez-Rodríguez R, Barzi M, Berenguer J, Pons S. Bone morphogenetic protein 2 opposes Shh-mediated proliferation in cerebellar granule cells through a TIEG-1-based regulation of Nmyc. J Biol Chem. 2007;282:37170–80. - PubMed
    1. Annunziata CM, Davis RE, Demchenko Y, Bellamy W, Gabrea A, Zhan F, et al. Frequent engagement of the classical and alternative NF-kappaB pathways by diverse genetic abnormalities in multiple myeloma. Cancer Cell. 2007;12:115–30. - PMC - PubMed
    1. April C, Klotzle B, Royce T, Wickham-Garcia E, Boyaniwsky T, Izzo J, et al. Whole-genome gene expression profiling of formalin-fixed, paraffin-embedded tissue samples. PLoS ONE. 2009;4:e8162. - PMC - PubMed
    1. Arévalo JC, Waite J, Rajagopal R, Beyna M, Chen Z-Y, Lee FS, et al. Cell survival through Trk neurotrophin receptors is differentially regulated by ubiquitination. Neuron. 2006;50:549–59. - PubMed

Publication types

MeSH terms