

Reciprocal sign epistasis between frequently experimentally evolved adaptive mutations causes a rugged fitness landscape
- PMID: 21552329
- PMCID: PMC3084205
- DOI: 10.1371/journal.pgen.1002056
Reciprocal sign epistasis between frequently experimentally evolved adaptive mutations causes a rugged fitness landscape
Abstract
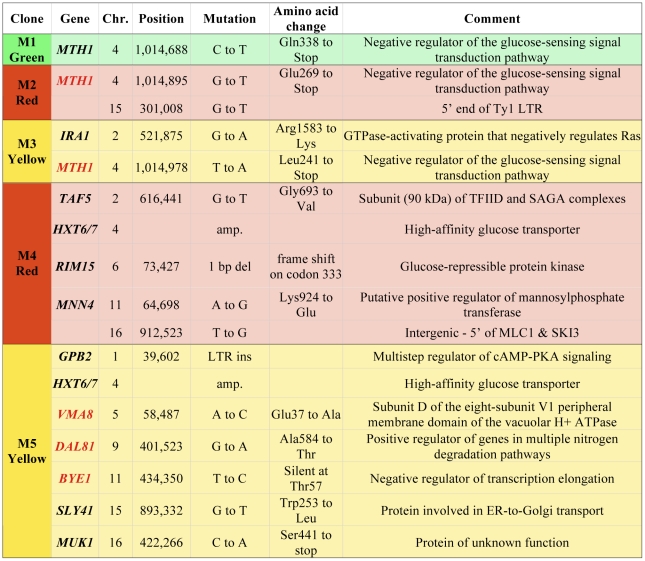
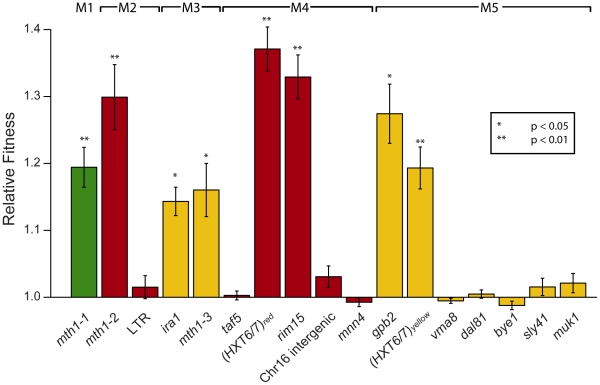
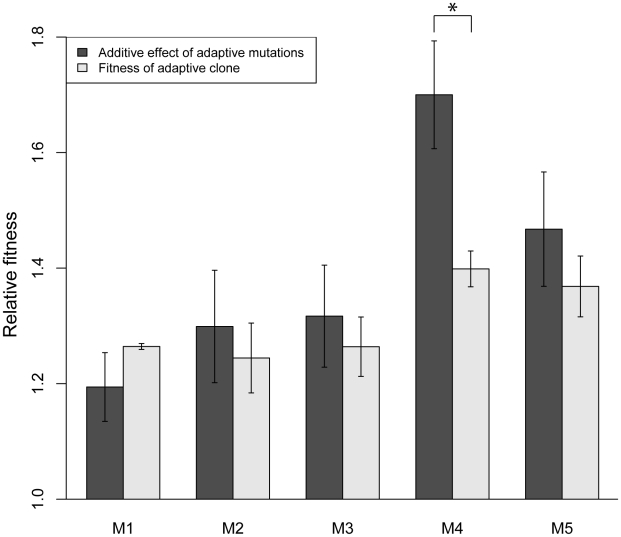
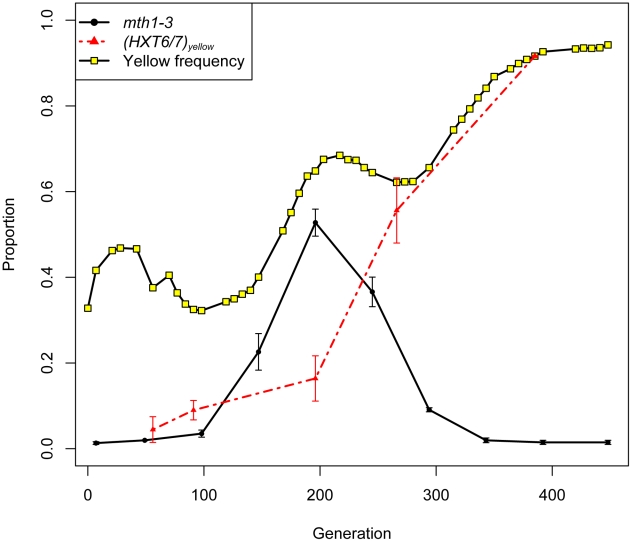
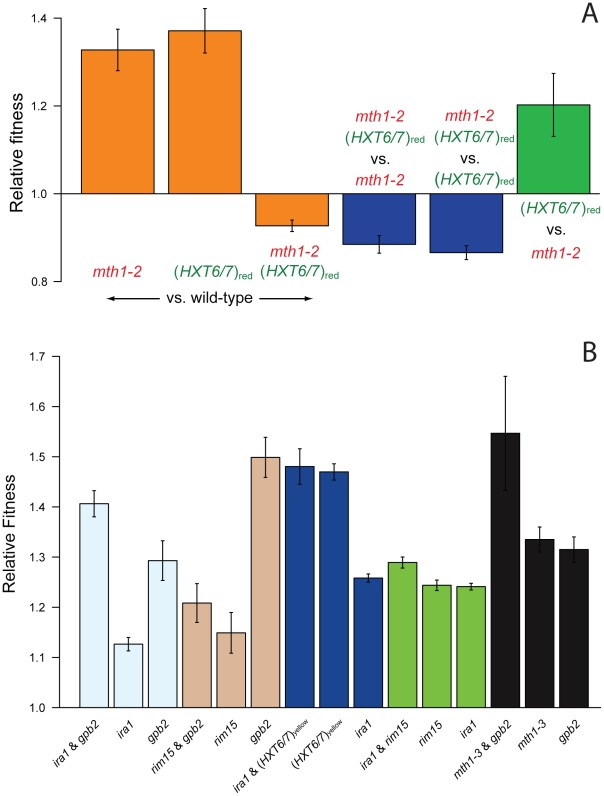
The fitness landscape captures the relationship between genotype and evolutionary fitness and is a pervasive metaphor used to describe the possible evolutionary trajectories of adaptation. However, little is known about the actual shape of fitness landscapes, including whether valleys of low fitness create local fitness optima, acting as barriers to adaptive change. Here we provide evidence of a rugged molecular fitness landscape arising during an evolution experiment in an asexual population of Saccharomyces cerevisiae. We identify the mutations that arose during the evolution using whole-genome sequencing and use competitive fitness assays to describe the mutations individually responsible for adaptation. In addition, we find that a fitness valley between two adaptive mutations in the genes MTH1 and HXT6/HXT7 is caused by reciprocal sign epistasis, where the fitness cost of the double mutant prohibits the two mutations from being selected in the same genetic background. The constraint enforced by reciprocal sign epistasis causes the mutations to remain mutually exclusive during the experiment, even though adaptive mutations in these two genes occur several times in independent lineages during the experiment. Our results show that epistasis plays a key role during adaptation and that inter-genic interactions can act as barriers between adaptive solutions. These results also provide a new interpretation on the classic Dobzhansky-Muller model of reproductive isolation and display some surprising parallels with mutations in genes often associated with tumors.
Conflict of interest statement
The authors have declared that no competing interests exist.
Figures
References
-
- Wright S. The roles of mutation, inbreeding, crossbreeding and selection in evolution. Proceedings of The Sixth Congress on Genetics. 1932:356–366.
-
- Wright S. Surfaces of Selective Value Revisited. The American Naturalist. 1988;131:115–123.
-
- Whitlock MC, Phillips PC, Moore FBG, Tonsor SJ. Multiple Fitness Peaks and Epistasis. Annu Rev Ecol Syst. 1995;26
-
- Gavrilets S. Fitness Landscapes and the Origin of Species; In: Levin SA, Horn HS, editors. Princeton, NJ: Princeton University Press; 2004.
-
- Brodie ED. Why Evolutionary Genetics Does Not Always Add Up. In: Wolf JB, Brodie ED, Wade MJ, editors. Epistasis and the Evolutionary Process. New York: Oxford University Press; 2000.
Publication types
MeSH terms
Substances
Grants and funding
LinkOut - more resources
Full Text Sources
Molecular Biology Databases
