

A stochastic model of latently infected cell reactivation and viral blip generation in treated HIV patients
- PMID: 21552334
- PMCID: PMC3084212
- DOI: 10.1371/journal.pcbi.1002033
A stochastic model of latently infected cell reactivation and viral blip generation in treated HIV patients
Abstract
Motivated by viral persistence in HIV+ patients on long-term anti-retroviral treatment (ART), we present a stochastic model of HIV viral dynamics in the blood stream. We consider the hypothesis that the residual viremia in patients on ART can be explained principally by the activation of cells latently infected by HIV before the initiation of ART and that viral blips (clinically-observed short periods of detectable viral load) represent large deviations from the mean. We model the system as a continuous-time, multi-type branching process. Deriving equations for the probability generating function we use a novel numerical approach to extract the probability distributions for latent reservoir sizes and viral loads. We find that latent reservoir extinction-time distributions underscore the importance of considering reservoir dynamics beyond simply the half-life. We calculate blip amplitudes and frequencies by computing complete viral load probability distributions, and study the duration of viral blips via direct numerical simulation. We find that our model qualitatively reproduces short small-amplitude blips detected in clinical studies of treated HIV infection. Stochastic models of this type provide insight into treatment-outcome variability that cannot be found from deterministic models.
Conflict of interest statement
The authors have declared that no competing interests exist.
Figures
 and
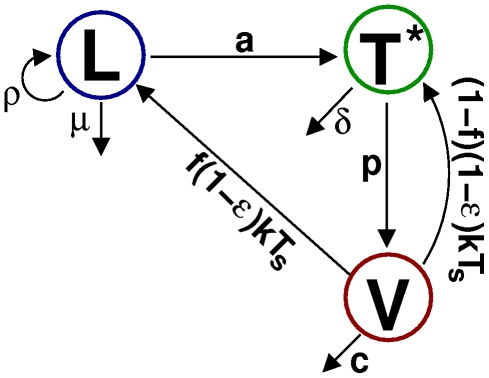
and  respectively. Productively infected cells (T*) die at rate
  and produce virus (V) continuously, at rate
  . Free virions are cleared at rate
  and infect healthy cells at rate
  , reduced by drug treatment of efficacy
  . A fraction
  of newly infected cells become latently infected cells and the rest become productively infected cells.
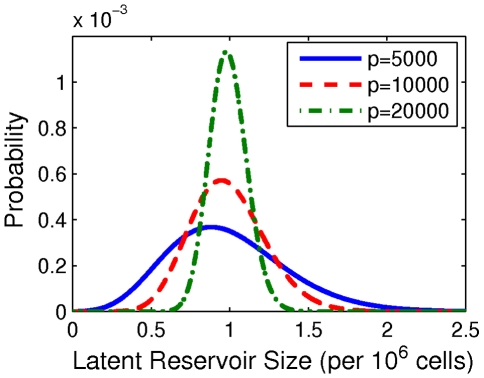
 have units
  . Initial distributions assuming initial mean viral load of 35 c/mL (Table 3) are qualitatively similar (not shown).
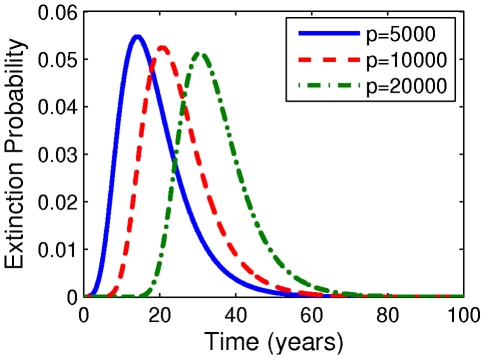
 have units
  .
.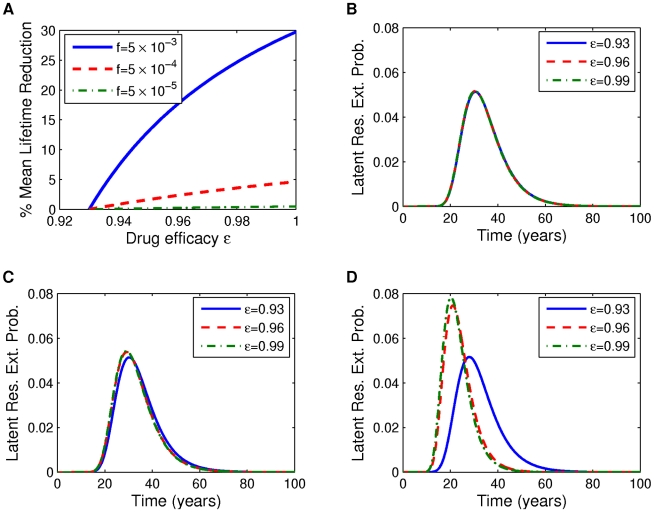
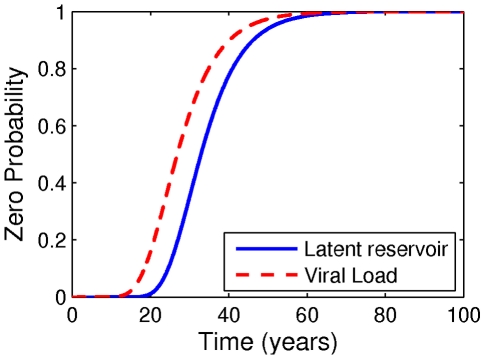
 . (B–D) Corresponding latent reservoir extinction distributions with improving drug efficacy for fraction
  of newly infected cells becoming latently infected (B)
  , (C)
, (C)  , (D)
, (D)  . Parameters: Tables 1 and 2 with
  .
.
 .
.
 , (B)
, (B)  , (C)
, (C)  . Insets: enlargement of probability distribution curves above the detection level,
  ; a log scale is used to better distinguish the curves. As time advances the distributions move from right to left. (D) Blip probability plotted against time. The curves in (D) are computed by integrating the probability density functions from (A–C) over viral loads exceeding 50 c/mL.
 and activation rates
  . Dashed lines indicate target cell multiplier 100 (vertical) and activation rate multiplier 5 (horizontal). (B) Maximum mean viral load (symbols)
  one standard deviation (shaded area) depending on activation rate multiplier, for target cell multiplier 100 (along vertical line in (A)). (C) Maximum mean viral load (symbols)
  one standard deviation (shaded area) depending on target cell multiplier, for activation rate multiplier 5 (along horizontal line in (A)). Parameters: Tables 1 and 2 with
  ,
,  and drug efficacy
  .
.
 standard deviation (shaded area), computed over 10000 simulations, plotted as a function of the initial viral load measurement (initial blip amplitude). Production rates
  have units
  . (B) Frequency plots of time distributions of detectable viral load given initial measurements of 60–90 c/mL, computed over 10000 simulations. Parameters: Tables 1 and 2; latent reservoir size 1 per
  cells;
  in (B).
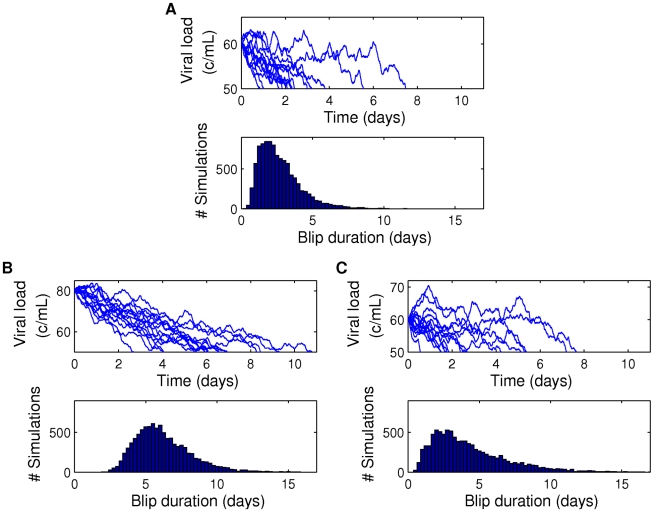
 cells; (B) initial viral load measurement of 80 c/mL with latent reservoir size 1 per
  cells; (C) initial viral load measurement of 60 c/mL with latent reservoir size 1.5 per
  cells. Parameters: Tables 1 and 2, for
  .
.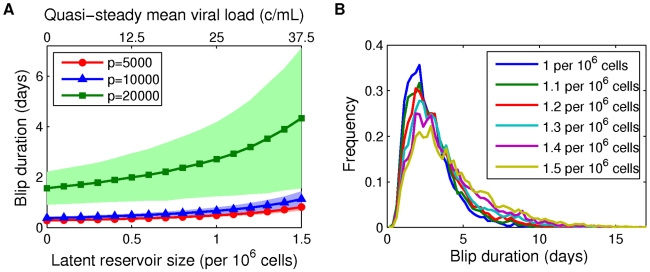
 1 standard deviation (shaded area), computed over 10000 simulations, plotted as a function of the initial latent reservoir size. (B) Frequency plots of time distributions of detectable viral load given initial latent reservoir sizes of 1–1.5 cells per
  . Parameters: Tables 1 and 2; initial viral load measurement of 60 c/mL;
  in (B).
Similar articles
-
Stochastic population switch may explain the latent reservoir stability and intermittent viral blips in HIV patients on suppressive therapy.J Theor Biol. 2014 Nov 7;360:137-148. doi: 10.1016/j.jtbi.2014.06.042. Epub 2014 Jul 10. J Theor Biol. 2014. PMID: 25016044
-
Modeling latently infected cell activation: viral and latent reservoir persistence, and viral blips in HIV-infected patients on potent therapy.PLoS Comput Biol. 2009 Oct;5(10):e1000533. doi: 10.1371/journal.pcbi.1000533. Epub 2009 Oct 16. PLoS Comput Biol. 2009. PMID: 19834532 Free PMC article.
-
Stochastic modelling of viral blips in HIV-1-infected patients: effects of inhomogeneous density fluctuations.J Theor Biol. 2015 Apr 21;371:79-89. doi: 10.1016/j.jtbi.2015.02.001. Epub 2015 Feb 11. J Theor Biol. 2015. PMID: 25681146
-
Insight into treatment of HIV infection from viral dynamics models.Immunol Rev. 2018 Sep;285(1):9-25. doi: 10.1111/imr.12698. Immunol Rev. 2018. PMID: 30129208 Free PMC article. Review.
-
[Potential of integrase inhibitors to deplete HIV reservoirs or prevent their replenishment].Enferm Infecc Microbiol Clin. 2008 Nov;26 Suppl 12:17-22. doi: 10.1016/s0213-005x(08)76568-6. Enferm Infecc Microbiol Clin. 2008. PMID: 19572421 Review. Spanish.
Cited by
-
Trade-off between synergy and efficacy in combinations of HIV-1 latency-reversing agents.PLoS Comput Biol. 2018 Feb 16;14(2):e1006004. doi: 10.1371/journal.pcbi.1006004. eCollection 2018 Feb. PLoS Comput Biol. 2018. PMID: 29451894 Free PMC article.
-
Modelling HIV-1 control and remission.NPJ Syst Biol Appl. 2024 Aug 8;10(1):84. doi: 10.1038/s41540-024-00407-8. NPJ Syst Biol Appl. 2024. PMID: 39117718 Free PMC article. Review.
-
The effect of random virus failure following cell entry on infection outcome and the success of antiviral therapy.Sci Rep. 2023 Oct 11;13(1):17243. doi: 10.1038/s41598-023-44180-w. Sci Rep. 2023. PMID: 37821517 Free PMC article.
-
Simple mathematical models do not accurately predict early SIV dynamics.Viruses. 2015 Mar 13;7(3):1189-217. doi: 10.3390/v7031189. Viruses. 2015. PMID: 25781919 Free PMC article.
-
Unified model of short- and long-term HIV viral rebound for clinical trial planning.J R Soc Interface. 2021 Apr;18(177):20201015. doi: 10.1098/rsif.2020.1015. Epub 2021 Apr 14. J R Soc Interface. 2021. PMID: 33849338 Free PMC article.
References
-
- Bowman MC, Archin NM, Margolis DM. Pharmaceutical approaches to eradication of persistent HIV infection. Expert Rev Mol Med. 2009;11:e6. - PubMed
-
- Dornadula G, Zhang H, VanUitert B, Stern J, Livornese L, et al. Residual HIV-1 RNA in blood plasma of patients taking suppressive highly active antiretroviral therapy. JAMA - J Am Med Assoc. 1999;282:1627–1632. - PubMed
-
- Pamer EG. Immune responses to Listeria monocytogenes. Nat Rev Immunol. 2004;4:812–823. - PubMed
Publication types
MeSH terms
Grants and funding
LinkOut - more resources
Full Text Sources
Medical
