Meta-Analysis
. 2011 Apr 28;7(5):551-66.
doi: 10.7150/ijbs.7.551.

Varied pathways of stage IA lung adenocarcinomas discovered by integrated gene expression analysis

Affiliations
Meta-Analysis

Varied pathways of stage IA lung adenocarcinomas discovered by integrated gene expression analysis

Chengwen Chen et al. Int J Biol Sci. .

Abstract

Background: Discovery of the progression-associated genes and pathways in lung adenocarcinoma (LAD) has important implications in understanding the molecular mechanism of tumor development. However, few studies had been performed to focus on the changes of pathways in lung adenocarcinoma development using microarray expression profile.

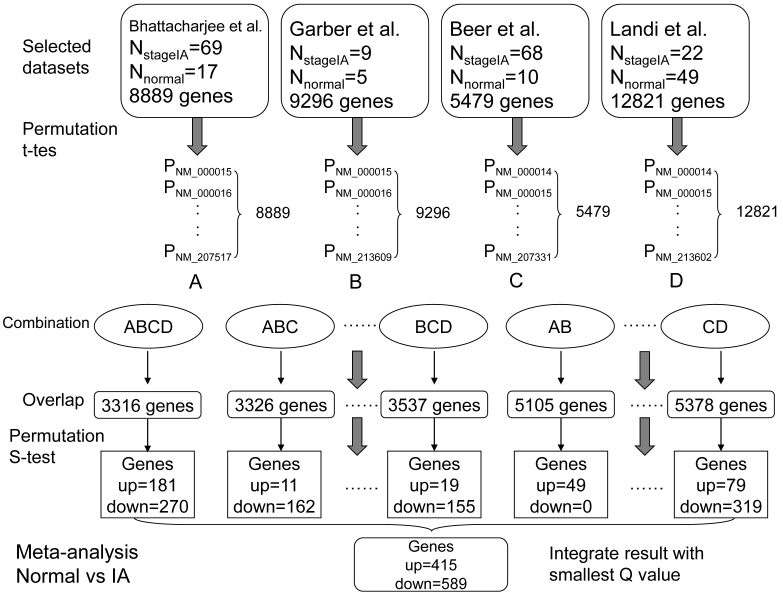
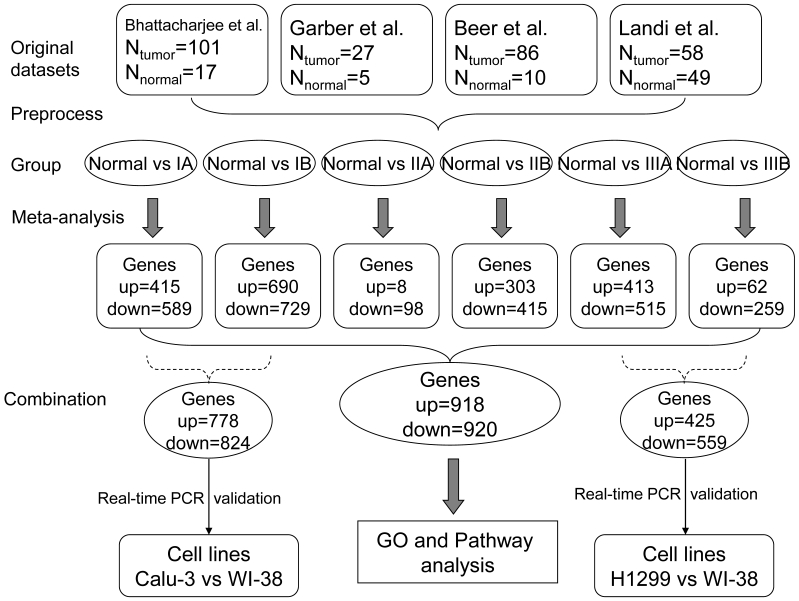
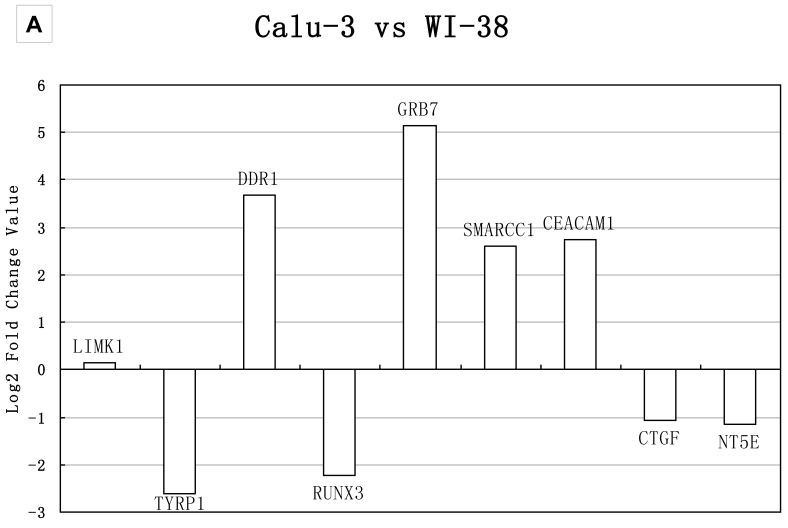
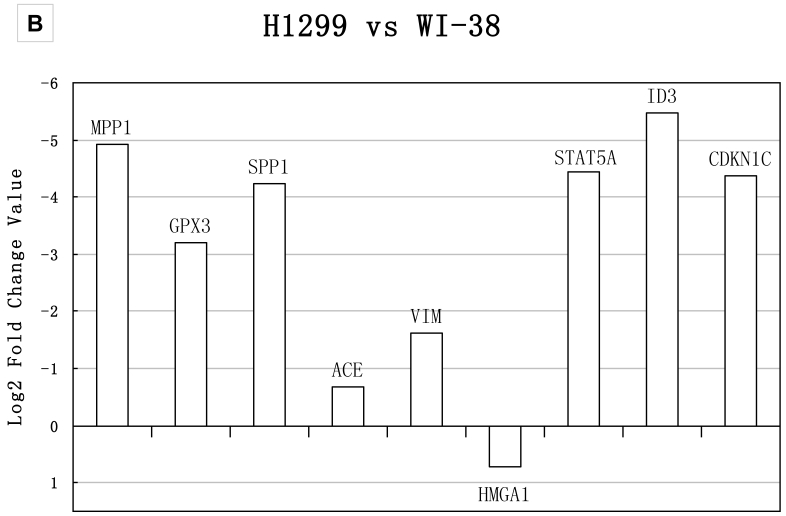
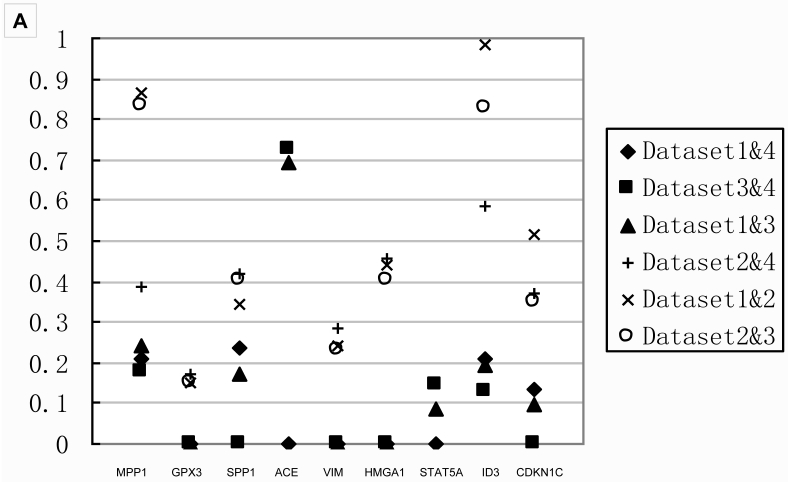
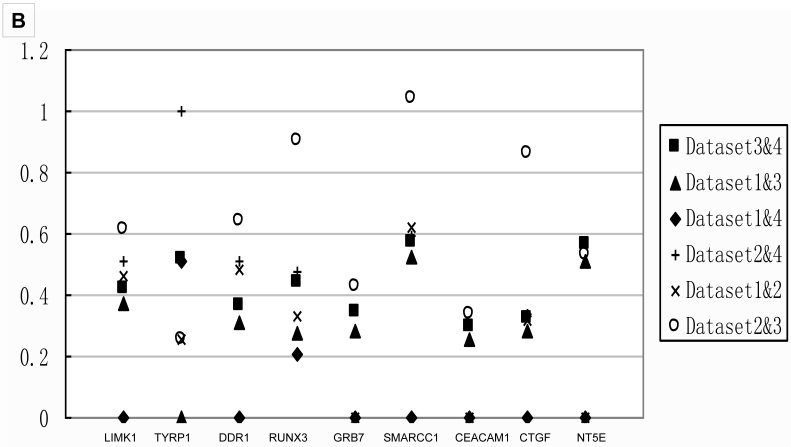
Result: We performed a meta-analysis of 4 LAD microarray datasets encompassing 353 patients to reveal differentially expressed genes (DEGs) between normal lung tissues and LAD of different stages. Overall, 1 838 genes were found to be dys-regulated, and the adipogenesis, circadian rhythm, and Id pathways were significantly changed. Interestingly, most of the genes from the same gene family (such as Interleukin receptor, Matrix metallopeptidase, Histone cluster and Minichromosome maintenance complex component families) were found to be up-regulated (or down-regulated). Real-time PCR (qRT-PCR) was applied to validate the expression of randomly selected 18 DEGs in LAD cell lines. In the pathway analysis among stages, Oxidative stress, Glycolysis/Gluconeogenesis and Integrin-mediated cell adhesion pathways, which were involved in cancer cell proliferation and metastasis, were showed to be significantly regulated in stages other than IA.

Conclusion: Genes involved in adipogenesis and Id pathways might play important roles in development of LADs. The similar trend of expression of the gene family members suggested coordinate regulation in tumor progression. Three pathways (Oxidative stress, Glycolysis/Gluconeogenesis and Integrin-mediated cell adhesion pathways) significantly regulated in stages other than stage IA suggested that genes and pathways conferring invasive character might be activated in the preinvasive stage IB, while the Oxidative stress and the Glycolysis/Gluconeogenesis pathways might have strong connections to cisplatin-based chemotherapy. The insignificantly regulated three pathways in stage IA might be used in early-stage detection of LAD.

Keywords: lung adenocarcinoma; meta-analysis; pathway; sample size.


Conflict of interest statement

Conflict of Interests: The authors have declared that no conflict of interest exists.

Figures

Figure 1
Figure 1
A model for meta-analysis of microarrays (Normal vs stage IA). Firstly, 10,000 one-sided random permutation t tests were performed between normal group and stage IA group in each dataset, and generated a series of P values. Secondly, the datasets were assigned to different combinations, such as all four datasets (ABCD). For a given combination, the overlapping genes and their corresponding P values were picked out. Thirdly, the random permutation s test (Formula 1) was calculated in every combination and the significant changed genes (up- or down- regulated in tumors compared with normal tissues) were screened with Q values (Q<0.1) (Formula 2). Formula 1: S = -2*log (p1) + -2*log (p2) + … + -2*log (pn). [p is P(t) value; n is the total number of datasets]. Formula 2: Q = (P*n)/i. [P is P(s) value; n is the total number of genes; i is the index of sorted P (s)].
Figure 2
Figure 2
Flow diagrams for data analysis. The datasets were assigned into several comparison groups between normal tissues and LADs in different stages. The meta-analysis was performed in each comparison to generate significantly changed genes (see Figure 1 for details), which were reserved for GO and Pathway analysis. The randomly selected DEGs from Normal vs IA and Normal vs IB were tested in Calu-3 lung adenocarcinoma and WI-38 normal lung cell lines using real-time PCR; DEGs from Normal vs IIIA and Normal vs IIIB were validated with H1299 lung adenocarcinoma and WI-38 cell lines by real-time PCR.
Figure 3
Figure 3
Real-time PCR validations of 18 candidate genes. Bars represent log2 fold changes of the selected genes with differential expression between A) Calu-3 and WI-38, B) H1299 and WI-38. Positive represents up-regulated and negative represents down-regulated in tumor cells compared with normal lung cells. The group A gene TYRP1, DDR1, RUNX3, GRB7, SMARCC1, CEACAM1, CTGF showed >2-fold change in mRNA expression level, which were in consistency with the result of meta-analysis. NT5E and LIMK1 showed no significant change in mRNA expression; the fold changes were 1.19 and 1.1, respectively. The group B gene MPP1, GPX3, ACE, STAT5A, ID3 and CDKN1C showed >2-fold change in mRNA expression level, which were in consistency with the result of meta-analysis. The expression of VIM and HMGA1 had the same up- and down- regulation tendency compared with the meta-analysis result, but showed no significant change in real-time PCR analysis. SPP1 showed the opposite regulation tendency.
Figure 3
Figure 3
Real-time PCR validations of 18 candidate genes. Bars represent log2 fold changes of the selected genes with differential expression between A) Calu-3 and WI-38, B) H1299 and WI-38. Positive represents up-regulated and negative represents down-regulated in tumor cells compared with normal lung cells. The group A gene TYRP1, DDR1, RUNX3, GRB7, SMARCC1, CEACAM1, CTGF showed >2-fold change in mRNA expression level, which were in consistency with the result of meta-analysis. NT5E and LIMK1 showed no significant change in mRNA expression; the fold changes were 1.19 and 1.1, respectively. The group B gene MPP1, GPX3, ACE, STAT5A, ID3 and CDKN1C showed >2-fold change in mRNA expression level, which were in consistency with the result of meta-analysis. The expression of VIM and HMGA1 had the same up- and down- regulation tendency compared with the meta-analysis result, but showed no significant change in real-time PCR analysis. SPP1 showed the opposite regulation tendency.
Figure 4
Figure 4
Q values of two datasets combinations for 18 genes A) the Q values of stage IIIA from all two datasets combinations for 9 genes in group B. All the Q values from the meta-analyses integrating Dataset2 are on the top part, which indicated datasets with smaller sample size contributed to false negatives; B) the Q values of stage IB from all two datasets combinations for 9 genes in group A.. The Q values for those integrated Dataset2 tend to be on the top part too. Combination integrated Dataset2 were shown as solid. Note that Dataset2 did not contain the genes ACE and STAT5A. The result of stage IA was shown in Additional file 2: Supplementary Figure 1.
Figure 4
Figure 4
Q values of two datasets combinations for 18 genes A) the Q values of stage IIIA from all two datasets combinations for 9 genes in group B. All the Q values from the meta-analyses integrating Dataset2 are on the top part, which indicated datasets with smaller sample size contributed to false negatives; B) the Q values of stage IB from all two datasets combinations for 9 genes in group A.. The Q values for those integrated Dataset2 tend to be on the top part too. Combination integrated Dataset2 were shown as solid. Note that Dataset2 did not contain the genes ACE and STAT5A. The result of stage IA was shown in Additional file 2: Supplementary Figure 1.

Similar articles

Cited by

References

    1. Jemal A, Thun MJ, Ries LA, Howe HL, Weir HK. et al. Annual report to the nation on the status of cancer, 1975-2005, featuring trends in lung cancer, tobacco use, and tobacco control. J Natl Cancer Inst. 2008;100:1672–1694. - PMC - PubMed
    1. Kopfstein L, Christofori G. Metastasis: cell-autonomous mechanisms versus contributions by the tumor microenvironment. Cell Mol Life Sci. 2006;63:449–468. - PMC - PubMed
    1. Bild AH, Yao G, Chang JT, Wang Q, Potti A. et al. Oncogenic pathway signatures in human cancers as a guide to targeted therapies. Nature. 2005;439:353–357. - PubMed
    1. Mareel M, Leroy A. Clinical, cellular, and molecular aspects of cancer invasion. Physiol Rev. 2003;83:337–376. - PubMed
    1. Nordquist LT, Simon GR, Cantor A, Alberts WM, Bepler G. Improved survival in never-smokers vs current smokers with primary adenocarcinoma of the lung. Chest. 2004;126:347–351. - PubMed

Publication types