Reproducibility of SELDI Spectra Across Time and Laboratories
- PMID: 21552492
- PMCID: PMC3085423
- DOI: 10.4137/CIN.S6438
Reproducibility of SELDI Spectra Across Time and Laboratories
Abstract
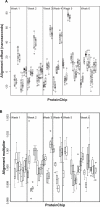
This is an open access article. Unrestricted non-commercial use is permitted provided the original work is properly cited.The reproducibility of mass spectrometry (MS) data collected using surface enhanced laser desorption/ionization-time of flight (SELDI-TOF) has been questioned. This investigation was designed to test the reproducibility of SELDI data collected over time by multiple users and instruments. Five laboratories prepared arrays once every week for six weeks. Spectra were collected on separate instruments in the individual laboratories. Additionally, all of the arrays produced each week were rescanned on a single instrument in one laboratory. Lab-to-lab and array-to-array variability in alignment parameters were larger than the variability attributable to running samples during different weeks. The coefficient of variance (CV) in spectrum intensity ranged from 25% at baseline, to 80% in the matrix noise region, to about 50% during the exponential drop from the maximum matrix noise. Before normalization, the median CV of the peak heights was 72% and reduced to about 20% after normalization. Additionally, for the spectra from a common instrument, the CV ranged from 5% at baseline, to 50% in the matrix noise region, to 20% during the drop from the maximum matrix noise. Normalization reduced the variability in peak heights to about 18%. With proper processing methods, SELDI instruments produce spectra containing large numbers of reproducibly located peaks, with consistent heights.
Keywords: analysis of variance/reproducibility/SELDI; mass spectrometry/wavelet.
Figures


Similar articles
-
Quality control and quality assessment of data from surface-enhanced laser desorption/ionization (SELDI) time-of flight (TOF) mass spectrometry (MS).BMC Bioinformatics. 2005 Jul 15;6 Suppl 2(Suppl 2):S5. doi: 10.1186/1471-2105-6-S2-S5. BMC Bioinformatics. 2005. PMID: 16026602 Free PMC article.
-
Evaluation of serum protein profiling by surface-enhanced laser desorption/ionization time-of-flight mass spectrometry for the detection of prostate cancer: I. Assessment of platform reproducibility.Clin Chem. 2005 Jan;51(1):102-12. doi: 10.1373/clinchem.2004.038950. Clin Chem. 2005. PMID: 15613711
-
Improved peak detection and quantification of mass spectrometry data acquired from surface-enhanced laser desorption and ionization by denoising spectra with the undecimated discrete wavelet transform.Proteomics. 2005 Nov;5(16):4107-17. doi: 10.1002/pmic.200401261. Proteomics. 2005. PMID: 16254928
-
Reproducibility in protein profiling by MALDI-TOF mass spectrometry.Clin Chem. 2007 May;53(5):852-8. doi: 10.1373/clinchem.2006.082644. Epub 2007 Mar 29. Clin Chem. 2007. PMID: 17395711 Review.
-
Surface-enhanced laser desorption ionization time-of-flight mass spectrometry (SELDI TOF-MS) and ProteinChip technology in proteomics research.Pathol Res Pract. 2004;200(2):83-94. doi: 10.1016/j.prp.2004.01.010. Pathol Res Pract. 2004. PMID: 15237917 Review.
Cited by
-
Proteomic classification of acute leukemias by alignment-based quantitation of LC-MS/MS data sets.J Proteome Res. 2012 Oct 5;11(10):5005-10. doi: 10.1021/pr300567r. Epub 2012 Sep 11. J Proteome Res. 2012. PMID: 22900933 Free PMC article.
-
Reproducible cancer biomarker discovery in SELDI-TOF MS using different pre-processing algorithms.PLoS One. 2011;6(10):e26294. doi: 10.1371/journal.pone.0026294. Epub 2011 Oct 14. PLoS One. 2011. PMID: 22022591 Free PMC article.
-
A critical assessment of SELDI-TOF-MS for biomarker discovery in serum and tissue of patients with an ovarian mass.Proteome Sci. 2012 Jul 23;10(1):45. doi: 10.1186/1477-5956-10-45. Proteome Sci. 2012. PMID: 22824475 Free PMC article.
-
Sparse Proteomics Analysis - a compressed sensing-based approach for feature selection and classification of high-dimensional proteomics mass spectrometry data.BMC Bioinformatics. 2017 Mar 9;18(1):160. doi: 10.1186/s12859-017-1565-4. BMC Bioinformatics. 2017. PMID: 28274197 Free PMC article.
-
Detection of bladder cancer using proteomic profiling of urine sediments.PLoS One. 2012;7(8):e42452. doi: 10.1371/journal.pone.0042452. Epub 2012 Aug 3. PLoS One. 2012. PMID: 22879988 Free PMC article.
References
-
- MacGregor G, Gray RD, Hilliard TN, et al. Biomarkers for cystic fibrosis lung disease: application of SELDI-TOF mass spectrometry to BAL fluid. J Cyst Fibros. 2008 Sep 7;(5):352–8. - PubMed
-
- Yang S, Xu L, Wu HM. Rapid multiplexed genotyping for hereditary thrombophilia by SELDI- TOF mass spectrometry. Diagn Mol Pathol. 2010 Mar;19(1):54–61. - PubMed
-
- De Young LX, Bella AJ, O’Gorman DB, Gan BS, Lim KB, Brock GB. Protein biomarker analysis of primary Peyronie’s disease cells. J Sex Med. 2010 Jan;7(1 Pt 1):99–106. - PubMed
-
- Simonsen AH, McGuire J, Podust VN, et al. Identification of a novel panel of cerebrospinal fluid biomarkers of Alzeheimer’s disease. Neurobiol Aging. 2008 Jul;29(7):961–8. - PubMed
Grants and funding
LinkOut - more resources
Full Text Sources
Miscellaneous

