

doi: 10.1016/j.pnmrs.2008.11.002.
Magnetic resonance imaging of cells in experimental disease models
Affiliations
- PMID: 21552511
- PMCID: PMC3087183
- DOI: 10.1016/j.pnmrs.2008.11.002
Item in Clipboard
Magnetic resonance imaging of cells in experimental disease models
Prog Nucl Magn Reson Spectrosc.
2009 Jul.
No abstract available
Figures
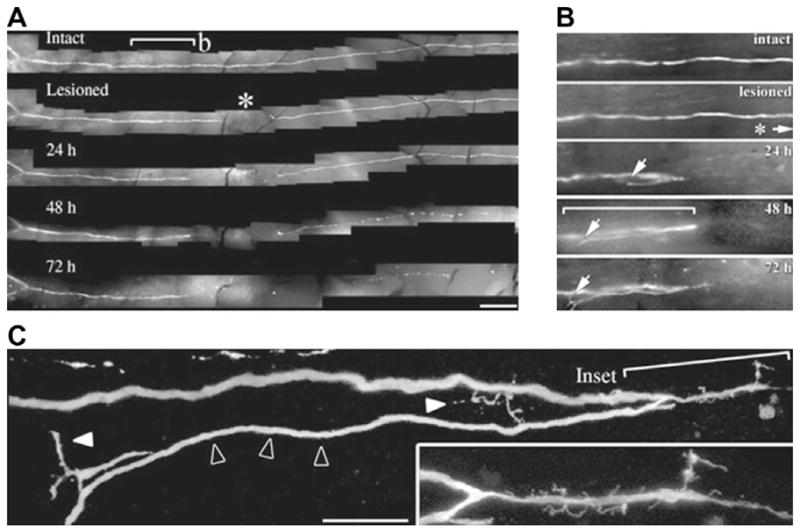
Serial multi-photon confocal fluorescent microscopy of a regenerating sensory axon in the central nervous system of a transgenic mouse engineered to express green fluorescent protein from the Thy1 promoter. This figure highlights the level of fine detail that is characteristic of multi-photon confocal microscopy along with the requirement of a limited cell population in a small field of view for semi-invasive detection. (A) Imaging of temporal differences in axon morphology following surgical transection demonstrates retraction and regeneration of the proximal axon within the course of 24 h and Wallerian degeneration of the distal axon stump within 48 h. Scale bar, 250 μm. (B) Closer inspection of the proximal axon reveals that the nerve regeneration is aberrant, proceeding in a direction opposite to that of denervated target tissue. (C) The long growing axon tip (open arrowheads) is of normal caliber and gives rise to smaller caliber, irregularly shaped, side branches (solid white arrowheads) and filopodia (inset). Scale bar, 25 μm. Reproduced, with permission, from Ref. [9].
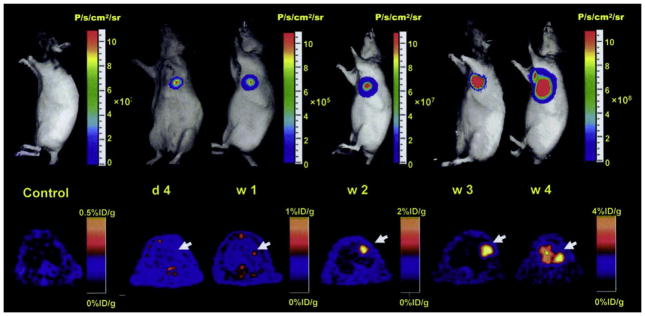
Cellular imaging of cardiomyocyte-differentiated murine ES cells that were transduced with a triple-fusion reporter gene construct prior to intramyocardial transplant into athymic nude rats. This figure highlights the ability of bioluminescent and PET imaging to reveal the general anatomical position, survival, and proliferation of transplanted cells. A representative animal showed significant bioluminescence (top) and PET (bottom) signals at day 4, week 1, week 2, week 3, and week 4. Firefly luciferase and truncated herpes simplex virus type 1 thymidine kinase (cytoplasmic form) activities increased significantly from week 2 to week 4 and extracardiac signals were observed during subsequent weeks. In this same study, the prodrug, ganciclovir, was later applied as a substrate for viral thymidine kinase phosphorylation to eliminate aberrant cells. Reduced, with permission, from Ref. [26].
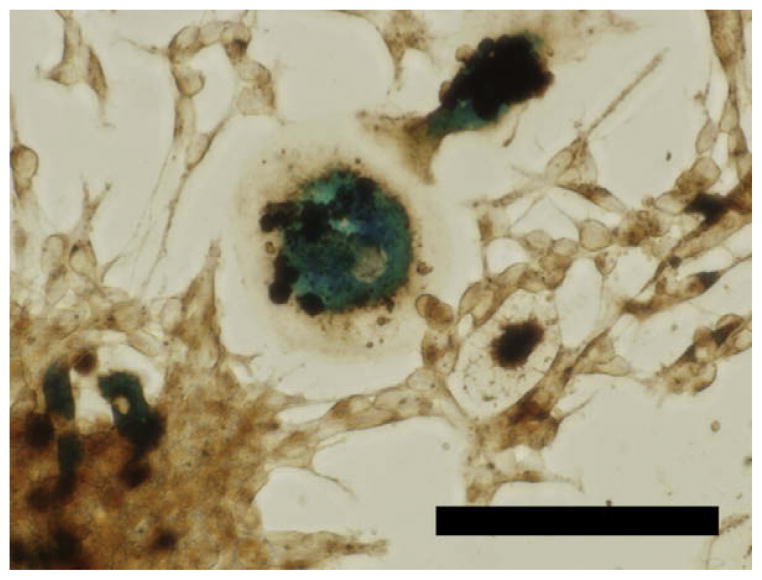
An example of the extensive phagocytic capacity of macrophages. Mouse neurospheres were labeled with Feridex/poly-L-lysine for 24 h using standard methods and allowed to adhere to the tissue culture dish. To confirm cell labeling, the culture was fixed with 4% paraformaldehyde and iron oxide nanoparticles were detected using a diaminobenzidine enhanced-Prussian blue protocol. In addition to numerous labeled neural precursors, this image contains two macrophages that have ingested more than six neural precursor cells that most likely did not survive the labeling procedure (unpublished data). Scale bar = 50 μm.
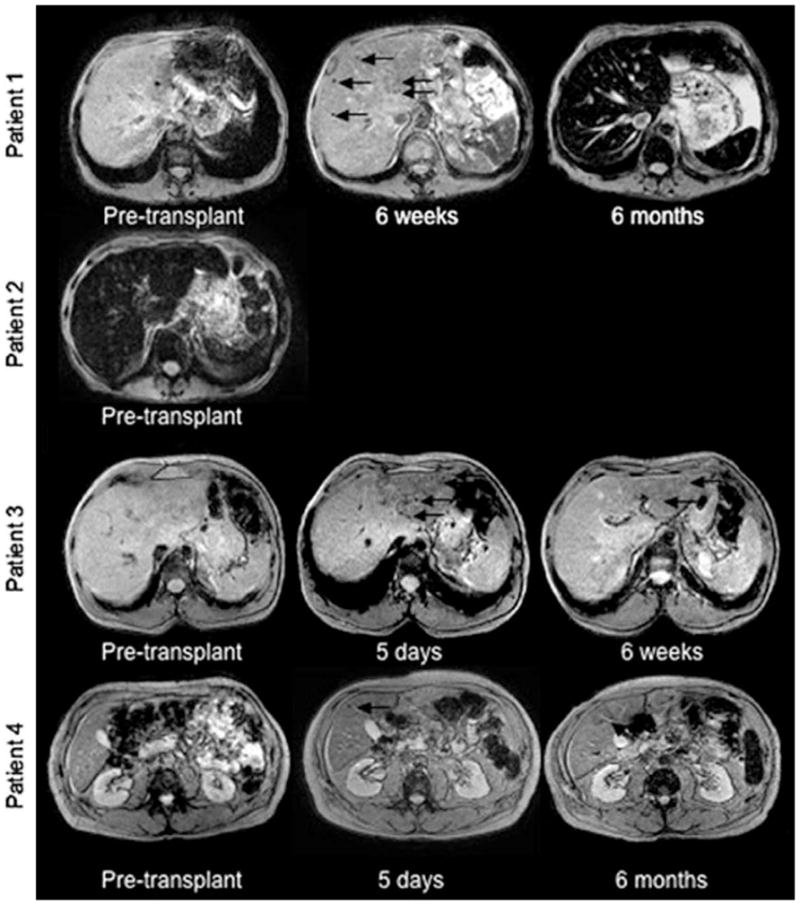
The safety and clinical application of cell tracking with SPIO was evaluated using human pancreatic islets which were transplanted into 4 patients after labeling with Endorem®, a clinical SPIO formulation. Compared to MR images obtained prior to transplantation, several hypointensities (black arrows) were detected within 5 days of transplantation and persisted for 6 weeks in Patient 1 and Patient 3; and as long as 6 months in Patient 4. This figure demonstrates the ability of MR imaging to detect variability in disease between patients as well as variability in graft survival and immunorejection. Reproduced, with permission, from Ref. [69].
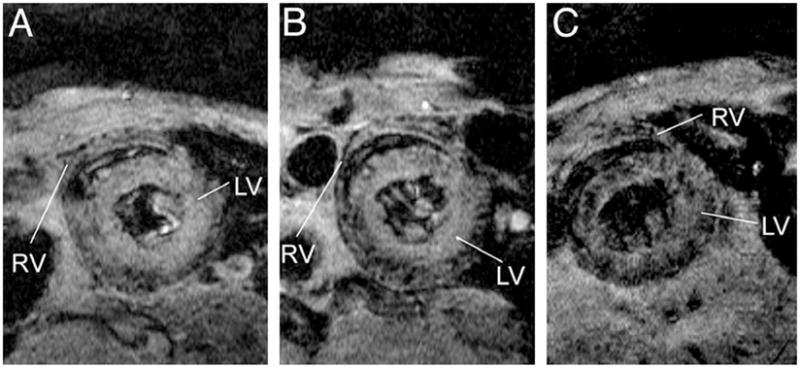
Serial MR detection of the accumulation of MPIO-labeled macrophages to a rejected cardiac allograft. A heart from a Dark-Agouti rat was transplanted in to Brown Norway rat, leading to acute tissue rejection based upon strain differences in immunological markers. MPIO was delivered intravenously 3.5 days after operation and macrophage recruitment to the transplanted heart was monitored by MR imaging at 3.5 days (A), 4.5 days (B) and, (C) 5.5 days. In (C), large numbers of punctate hypointensities are present in the parenchyma of the rejected heart. After comparing MPIO to USPIO for macrophage detection in rejected organs, this study found that single punctate hypointensities, presumably single macrophages, were more frequently detected using MPIO whereas USPIO resulted in larger, contiguous hypointensities. Reproduced, with permission, from Ref. [89].
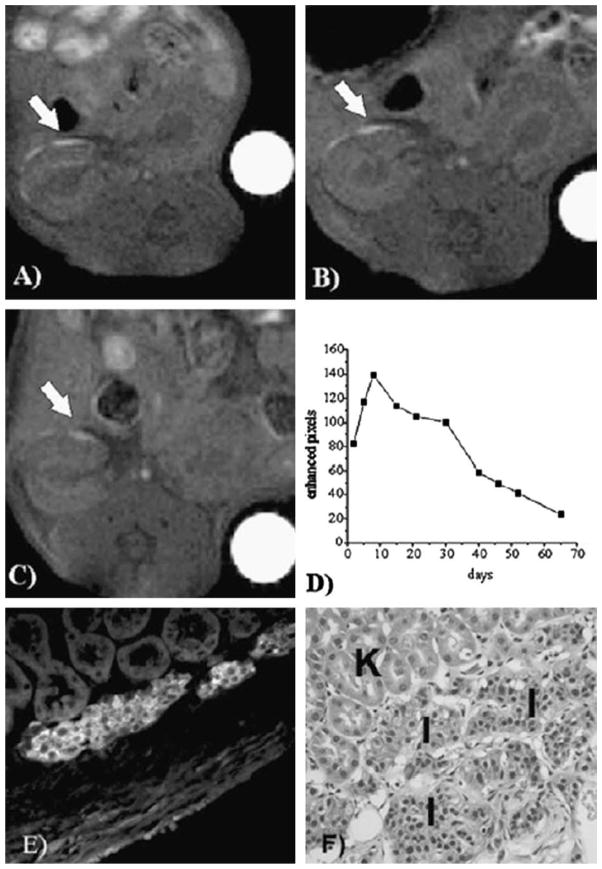
Serial MR detection of gadolinium-labeled pancreatic islets transplanted within the kidney capsule of immunodeficient mice. GdHDPO3A-labeled islets (white arrows) were detected at day 7 (A), day 30 (B), and day 65 (C) after transplantation into the kidney capsule. The number of enhanced pixels remained stable for one month and then declined steadily during the following month (D). Immunofluorescence (E) and histological (F) staining on day 65 demonstrate that the islet graft (I) was intact within the subcapsular space and distinct from kidney tubules (K). This study demonstrates that the neutral, hydrophilic contrast agent, GdHDPO3A, is well tolerated for long-term MR detection of nonproliferating cells following transplantation. In addition, this study shows how positive contrast using Gd can be applied to track cells in inherently T2 dark tissues, where iron oxides are less easily detected. Reproduced, with permission, from Ref. [94].
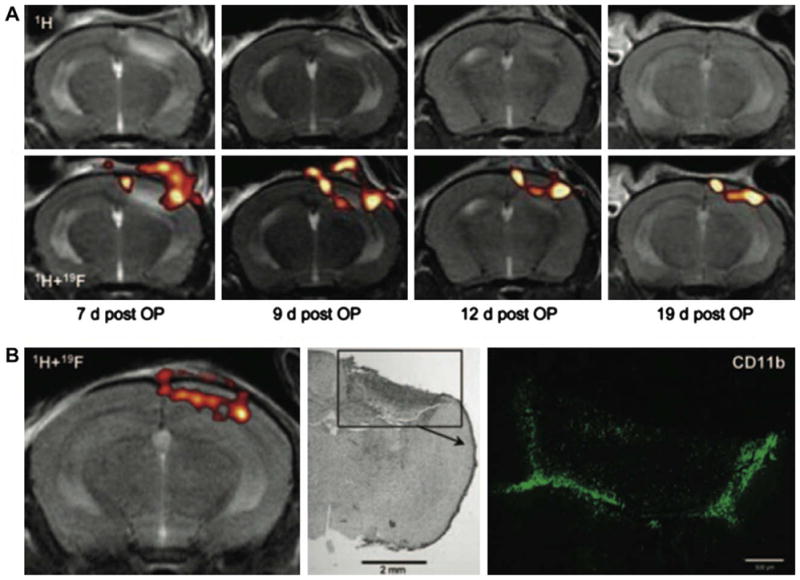
Serial MR detection of the accumulation of in situ-19F-labeled macrophages to a photothrombic CNS lesion. PFC was delivered intravenously on day 6 post-focal cerebral ischemia. MR imaging on day 7 reveals the presence of edema and inflammatory infiltrates in the right cerebral hemisphere (A, top left panel). MR imaging of 19F (A, bottom row) reveals the presence of labeled macrophages, indicated by “hot” pseudocoloring, within the same region. Edema decreased over time as detected by 1H MR imaging, whereas the presence of macrophages persisted for up to 19 days. In (B), the presence of 19F-labeled macrophages (left) within the lesion site (middle) was confirmed using immunohistochemistry for CD11b (green, right panel). Note the similarities in the distribution of 19F signal and CD11b immunoreactivity. This study accentuates the low background signal associated with MR imaging of 19F and the need to superimpose 1H and 19F images for anatomical correlation. In addition, panel B provides an idea of the number and degree of proximity of 19F-labeled cells that is necessary for MR detection. Reproduced, with permission, from Ref. [116].
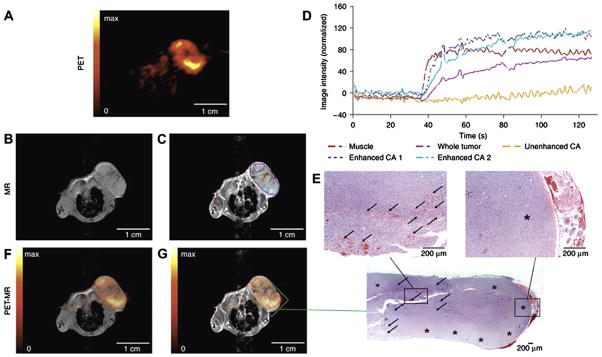
Fully integrated dual modality PET/MR imaging of a subcutaneous tumor. (A) PET images of (18F)FLT tracer uptake indicate regions of high cell proliferation (yellow) and necrosis (black). (B and C) Pre- and post-contrast MR images obtained using the same device reveal the underlying anatomy and further define sites of tissue necrosis (C, yellow region of interest in center of tumor). (D) Dynamic measurement of contrast enhancement within regions of interest highlighted in (C). (F and G) Coregistration of PET and MR images reveals areas of inflammation and necrosis that were confirmed by histology (E). Note that integration of the hardware for PET and MRI permits direct image coregistration as the anatomy of experimental subject was not shifted; as is often the case when moving patients between two imaging devices. Reproduced, with permission, from Ref. [14].
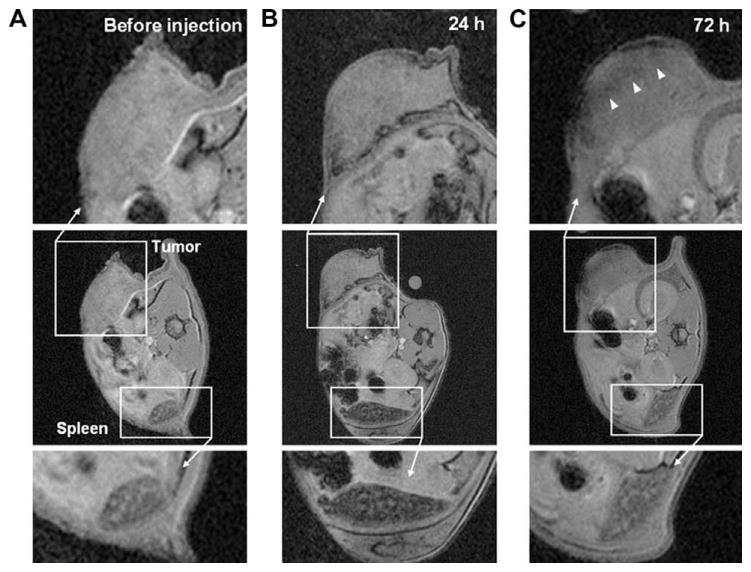
MR cell tracking of the progression of anticancer cell therapy. Ovalbumin-specific splenocytes (OT-1, 3 × 10⁶ cells, 1.3 pg iron/cell) were labeled with SPIO and adoptively transferred to mice harboring ovalbumin-expressing lymphoma cells. Prior to cell transfer, the tumor and spleen appear homogenous by
MR imaging (A). One day following cell transfer (B), the spleen showed significant negative contrast and volume enhancement whereas the tumor exhibited little change. After 72 h (C), the spleen showed slight positive contrast whereas the tumor became hypointense (white arrowheads). Reproduced, with permission, from Ref. [33].
Similar articles
-
Longitudinal in vivo magnetic resonance imaging studies in experimental allergic encephalomyelitis: effect of a neurotrophic treatment on cortical lesion development.Neuroscience. 1997 Apr;77(4):1163-73. doi: 10.1016/s0306-4522(96)00514-3. Neuroscience. 1997. PMID: 9130795
-
Quantitative magnetic resonance imaging of chronic kidney disease: an experimental in vivo study using rat chronic kidney disease models.Acta Radiol. 2023 Jan;64(1):404-414. doi: 10.1177/02841851211065143. Epub 2021 Dec 20. Acta Radiol. 2023. PMID: 34928730
-
Rabbit models of intracranial atherosclerotic disease for pathological validation of vessel wall MRI.Neuroradiol J. 2021 Jun;34(3):193-199. doi: 10.1177/1971400920980153. Epub 2020 Dec 16. Neuroradiol J. 2021. PMID: 33325806 Free PMC article.
-
Diagnostic accuracy and clinical impact of MRI-based technologies for patients with non-alcoholic fatty liver disease: systematic review and economic evaluation.Health Technol Assess. 2023 Jul;27(10):1-115. doi: 10.3310/KGJU3398. Health Technol Assess. 2023. PMID: 37839810 Free PMC article.
-
Magnetic resonance of mouse models of cardiac disease.Handb Exp Pharmacol. 2008;(185 Pt 2):245-57. doi: 10.1007/978-3-540-77496-9_10. Handb Exp Pharmacol. 2008. PMID: 18626605 Review.
Cited by
-
In vivo Cell Tracking Using Non-invasive Imaging of Iron Oxide-Based Particles with Particular Relevance for Stem Cell-Based Treatments of Neurological and Cardiac Disease.Mol Imaging Biol. 2020 Dec;22(6):1469-1488. doi: 10.1007/s11307-019-01440-4. Mol Imaging Biol. 2020. PMID: 31802361 Review.
-
Magnetic resonance imaging of transplanted stem cell fate in stroke.J Res Med Sci. 2014 May;19(5):465-71. J Res Med Sci. 2014. PMID: 25097631 Free PMC article. Review.
-
Molecular imaging of microglia/macrophages in the brain.Glia. 2013 Jan;61(1):10-23. doi: 10.1002/glia.22357. Epub 2012 May 21. Glia. 2013. PMID: 22615180 Free PMC article. Review.
-
ICV-transplanted human glial precursor cells are short-lived yet exert immunomodulatory effects in mice with EAE.Glia. 2012 Jul;60(7):1117-29. doi: 10.1002/glia.22339. Epub 2012 Apr 12. Glia. 2012. PMID: 22499166 Free PMC article.
-
Magnetic nanoparticles for oligodendrocyte precursor cell transplantation therapies: progress and challenges.Mol Cell Ther. 2014 Jul 28;2:23. doi: 10.1186/2052-8426-2-23. eCollection 2014. Mol Cell Ther. 2014. PMID: 26056590 Free PMC article. Review.
References
-
- Mazzarello P. Nat Cell Biol. 1999;1:E13–E15. - PubMed
-
- Hadjantonakis AK, Dickinson ME, Fraser SE, Papaioannou VE. Nat Rev Genet. 2003;4:613–625. - PubMed
-
- Shaner NC, Steinbach PA, Tsien RY. Nat Methods. 2005;2:905–909. - PubMed
-
- Giepmans BN, Adams SR, Ellisman MH, Tsien RY. Science. 2006;312:217–224. - PubMed
Grants and funding
LinkOut - more resources
Full Text Sources
Other Literature Sources
