. 2011 Apr 28;6(4):e18822.
doi: 10.1371/journal.pone.0018822.

In vivo analysis of inhibitory synaptic inputs and rebounds in deep cerebellar nuclear neurons

Affiliations

In vivo analysis of inhibitory synaptic inputs and rebounds in deep cerebellar nuclear neurons

Fredrik Bengtsson et al. PLoS One. .

Abstract

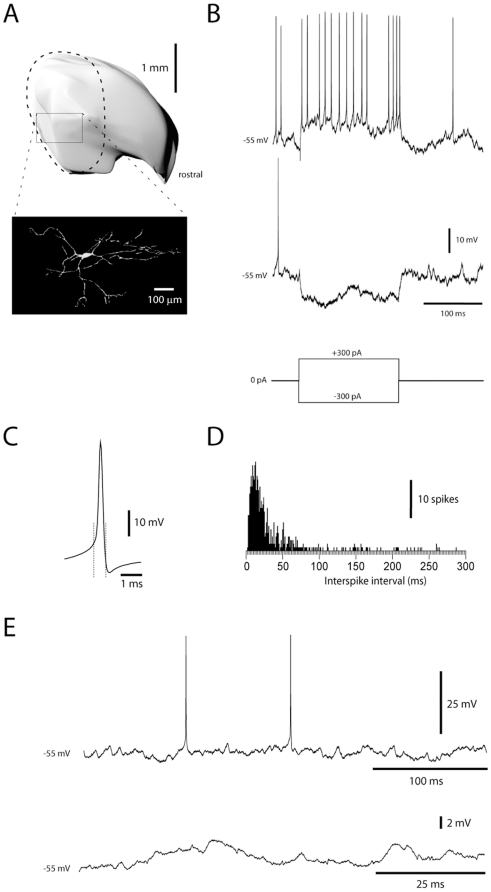
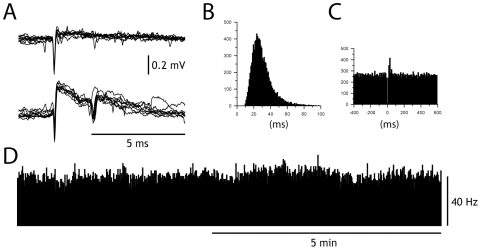
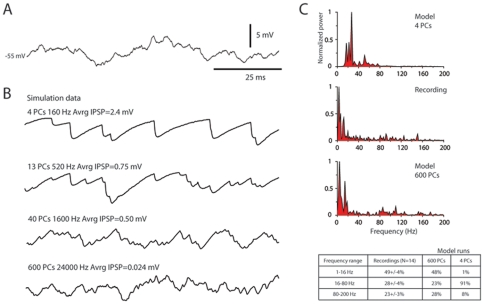
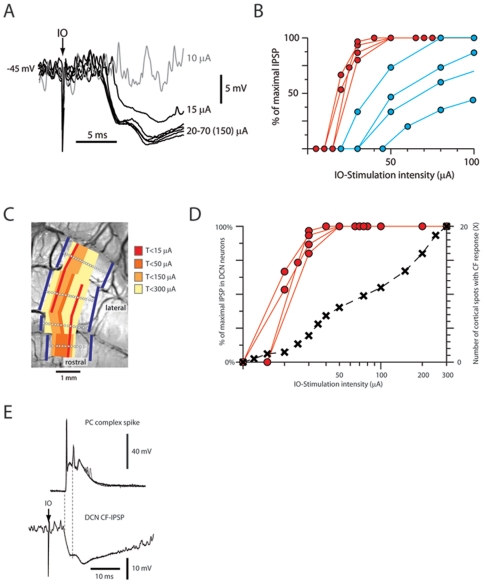
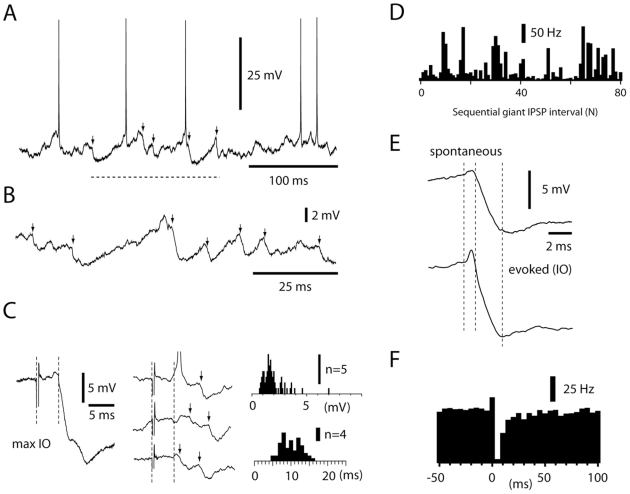
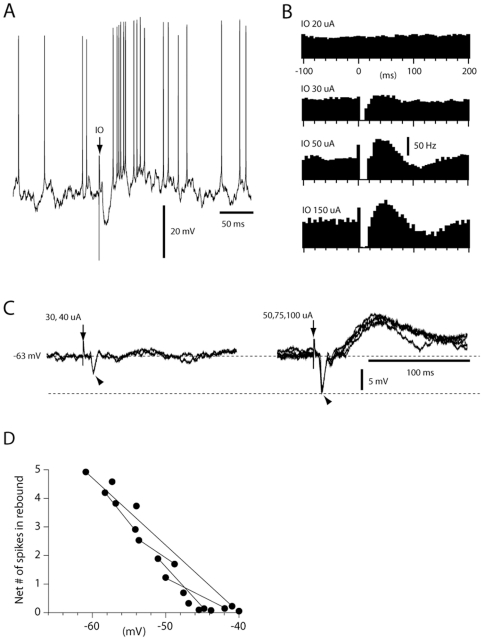
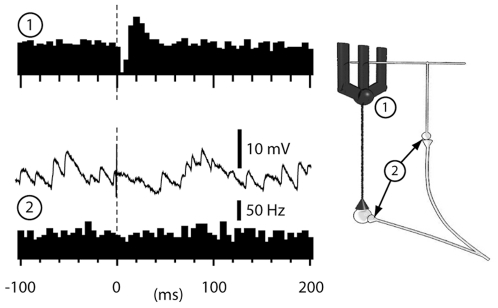
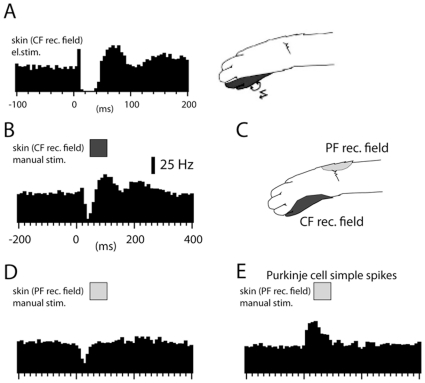
Neuronal function depends on the properties of the synaptic inputs the neuron receive and on its intrinsic responsive properties. However, the conditions for synaptic integration and activation of intrinsic responses may to a large extent depend on the level of background synaptic input. In this respect, the deep cerebellar nuclear (DCN) neurons are of particular interest: they feature a massive background synaptic input and an intrinsic, postinhibitory rebound depolarization with profound effects on the synaptic integration. Using in vivo whole cell patch clamp recordings from DCN cells in the cat, we find that the background of Purkinje cell input provides a tonic inhibitory synaptic noise in the DCN cell. Under these conditions, individual Purkinje cells appear to have a near negligible influence on the DCN cell and clear-cut rebounds are difficult to induce. Peripheral input that drives the simple spike output of the afferent PCs to the DCN cell generates a relatively strong DCN cell inhibition, but do not induce rebounds. In contrast, synchronized climbing fiber activation, which leads to a synchronized input from a large number of Purkinje cells, can induce profound rebound responses. In light of what is known about climbing fiber activation under behaviour, the present findings suggest that DCN cell rebound responses may be an unusual event. Our results also suggest that cortical modulation of DCN cell output require a substantial co-modulation of a large proportion of the PCs that innervate the cell, which is a possible rationale for the existence of the cerebellar microcomplex.


Conflict of interest statement

Competing Interests: The authors have declared that no competing interests exist.

Figures

Figure 1
Figure 1. Identification of DCN neurons in whole cell recordings.
(A) Location in the forelimb region (dashed line) of the anterior interposed nucleus (reconstructed in 3D) and morphological reconstruction of a DCN neuron, recorded with neurobiotin in the recording solution. (B) Responses of a DCN neuron to rectangular current step commands. (C) Average of 100 spikes recorded in one DCN neuron. Dashed lines indicate the start and the end of the spike, with the starting point defined as the point at which the second derivative of the voltage trace reached its peak value. (D) Frequency histogram of interspike intervals recorded in this cell. (E) Examples of spontaneous activity recorded at rest (0 pA bias current).
Figure 2
Figure 2. Activity in Purkinje cell projecting to the AIP.
(A) Superimposed simple spike (top) and complex spikes from PC recorded in the C3 zone. (B) Frequency distribution histogram of interspike intervals for the simple spike. Bin width, 1 ms. (C) Peri-complex spike histogram of simple spike activity. Bin width 10 ms. (D) Histogram showing that the simple spike frequency remained relatively constant over time. Bin width, 1 s. We recorded the simple and complex spike activity of 16 PCs during more than 5 mins. The average firing frequency for simple spikes was 42+/−5.4 Hz and for complex spikes 2.8+/−0.5 Hz.
Figure 3
Figure 3. Non-synchronized, high frequency IPSP inputs generate smooth baseline.
(A) Close-up of raw data. (B) Simulated data for varying number of PC inputs. The number of PCs, the average IPSP frequency and the average IPSP amplitude is indicated for each simulation run. (C) Power spectral density analysis for recorded signal and simulated signal with low and high number of PC inputs, respectively. Numerical comparisons were made for the relative power in different frequency intervals (inset table).
Figure 4
Figure 4. IPSPs evoked in DCN neurons by IO stimulation.
(A) Superimposed averages of IPSP responses evoked at different intensities of IO-stimulation in the same DCN cell. Note that even at nearly 10 times the stimulus intensity for evoking a maximal response, the amplitude of the response did not change. The double-peaked nature of the evoked IPSP matched that of the complex spikes in the afferent PCs (see panel E). (B) Stimulus-response curves for DCN cells with low-threshold IO-evoked IPSPs (T<15 uA, red curves) compared with stimulus-response curves for IO-evoked IPSPs in DCN neurons with higher thresholds (blue curves). (C) Thresholds for cerebellar cortical climbing fiber field responses along the longitudinal axis of different folia of the forelimb area of the C3 zone. The recording sites are indicated on a photograph of the cerebellar anterior lobe sublobules Va-Vc, in which the forelimb area of the C3 zone is located. The borders of the C3 zone are indicated by thick blue lines. The yellow to red coloring indicates the specific thresholds for evoking climbing fiber responses according to the key at left. (D) Comparison between stimulus response curves for low threshold DCN cell IPSPs and the number of cortical spots with evoked climbing fiber responses (data averaged from 5 experiments, indicated by dashed line and crosses). (E) Maximal IO-evoked IPSPs consistently displayed two peaks, separated by about 3 ms (3.4+/−0.7 ms, N = 5, analyzed only for cells with identified, low thresholds for IO-evoked IPSPs). The timing of the two peaks of the IPSP paralleled the timing of the first two spikes recorded in the complex spikes from whole cell PC recordings (2.5+/−0.3 ms, N = 9).
Figure 5
Figure 5. Properties of spontaneous giant IPSPs.
(A) Raw trace illustrating a sample period (dashed line) during which spontaneous giant IPSPs (arrows) occurred. (B) Close-up of another period with spontaneous giant IPSPs. (C) Raw traces of IPSPs (arrows, middle panel) and histogram of IPSP amplitudes (right panel) evoked by threshold IO stimulation. For comparison, the averaged maximal IO evoked IPSP is illustrated to the left. Dashed lines indicate onset of stimulation and onset latency time of the maximal IPSP. Note the later, variable response latencies (summarized in histogram at bottom right) of the threshold IPSPs, which are likely due to that the direct neuronal activation is replaced with a more indirect, synaptic activation of the IO neurons as the stimulation intensity is reduced . All recordings were made at −50 mV. Only IPSP events with an absolute amplitude >0.7 mV were analyzed. (D) Histogram of intervals between sequential giant IPSPs recorded during 3 minutes. The coefficient of variation of the intervals was 104%. (E) Average of the largest spontaneous giant IPSPs (N = 15) recorded from one DCN neuron and average of submaximal IO-evoked IPSPs (N = 10) recorded in the same neuron. Dashed lines indicate start of excitatory component, start of inhibitory component and peak of inhibitory component, respectively. (F) Peri-IPSP histogram of spike discharge relative to the onset of spontaneous giant IPSPs. Average from 9 DCN neurons. Bin width 5 ms.
Figure 6
Figure 6. IO-evoked rebound responses.
(A) Sample raw trace of rebound response evoked by maximal IO stimulation recorded at resting potential. (B) Spike responses evoked by subthreshold, submaximal, maximal and supramaximal IO stimulation (20, 30, 50 and 150 uA). Bin width, 5 ms. (C) Averages of responses evoked from the IO at different stimulation intensities recorded from another DCN neuron that was hyperpolarized to prevent spiking, Note all-or-nothing character of the rebound response as the IPSP (arrowheads) became maximal. (D) Relationship between membrane potential and the magnitude of the rebound response (expressed as net number of spikes, beyond prestimulus baseline, per stimulation). Lines indicate data obtained from the same cell at different membrane potentials.
Figure 7
Figure 7. IO-evoked responses in cortical neurons.
Simple spike responses of a PC (1) and MF-EPSP responses of a granule cell recorded in the whole cell mode (2) to IO stimulation. The granule cell data is shown both as a sample raw trace (recorded at −65 mV) and as a peristimulus histogram of EPSPs with IO-stimulation at 150 uA, which evoked substantial local climbing fiber field potentials in the cortex. Inset illustrates that the mossy fibers that innervate the DCN cells are collaterals of the mossy fibers that innervate the granule cells (2). Bin widths in all histograms, 5 ms.
Figure 8
Figure 8. DCN cell responses to skin stimulation.
(A) Spike responses of a DCN cell to electrical skin stimulation (single shock, 0.2 ms) within the climbing fiber receptive field. (B) Responses evoked by manual skin stimulation (50 ms) in the climbing fiber receptive field. (C) Locations of the parallel fiber and climbing fiber receptive fields for the PC input to the DCN neuron. (D) Response evoked by manual skin stimulation in the PC-parallel fiber receptive field. (E) For comparison, a peristimulus histogram of PC simple spike responses to manual skin stimulation within the parallel fiber receptive field. Histogram bin widths, 5 ms in (A), otherwise 10 ms.

References

    1. Destexhe A, Contreras D. Neuronal computations with stochastic network states. Science. 2006;314:85–90. - PubMed
    1. Destexhe A, Rudolph M, Pare D. The high-conductance state of neocortical neurons in vivo. Nat Rev Neurosci. 2003;4:739–751. - PubMed
    1. Wolfart J, Debay D, Le Masson G, Destexhe A, Bal T. Synaptic background activity controls spike transfer from thalamus to cortex. Nat Neurosci. 2005;8:1760–1767. - PubMed
    1. Gauck V, Jaeger D. The control of rate and timing of spikes in the deep cerebellar nuclei by inhibition. Journal of Neuroscience. 2000;20:3006–3016. - PMC - PubMed
    1. Anderson JS, Lampl I, Gillespie DC, Ferster D. The contribution of noise to contrast invariance of orientation tuning in cat visual cortex. Science. 2000;290:1968–1972. - PubMed

Publication types