. 2011 Apr 28;6(4):e19000.
doi: 10.1371/journal.pone.0019000.

Stage-specific pathways of Leishmania infantum chagasi entry and phagosome maturation in macrophages

Affiliations

Stage-specific pathways of Leishmania infantum chagasi entry and phagosome maturation in macrophages

Nilda E Rodríguez et al. PLoS One. .

Abstract

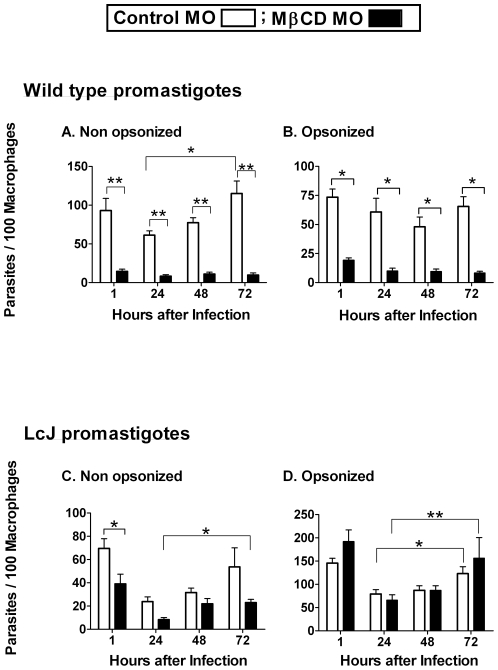
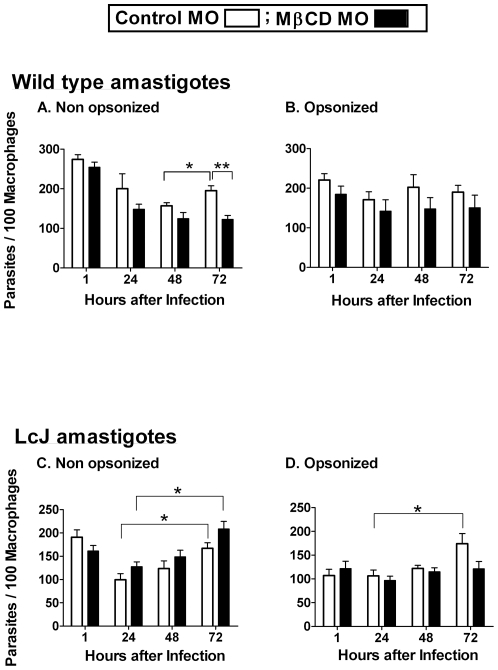
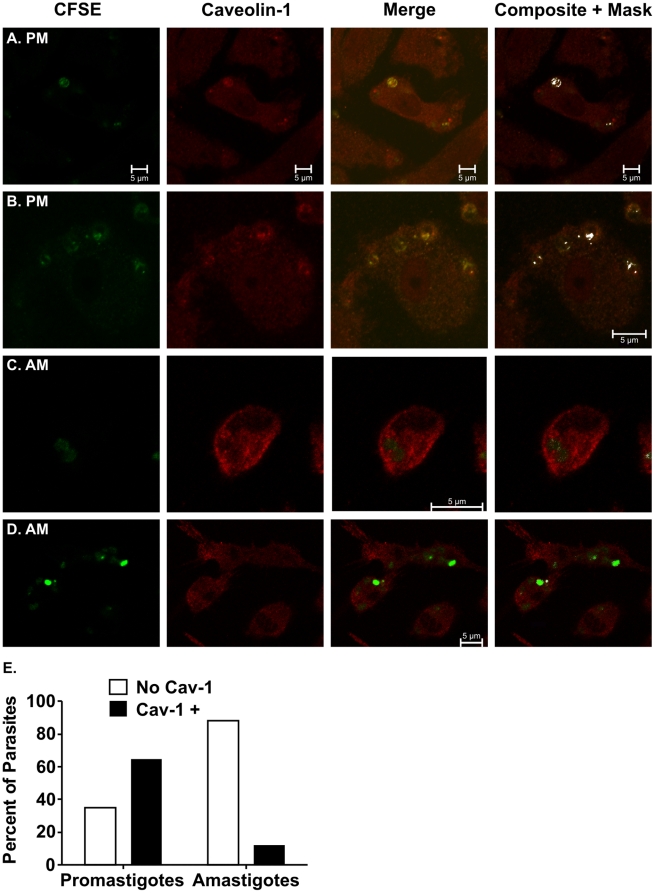
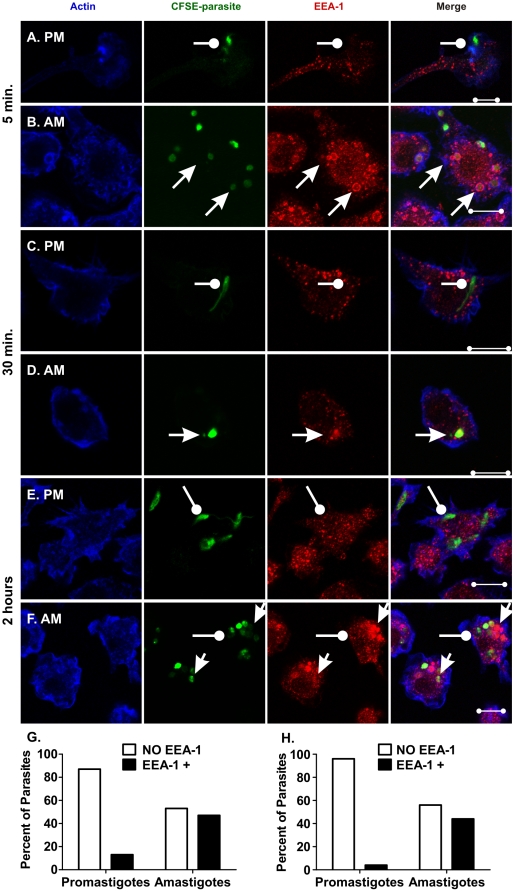
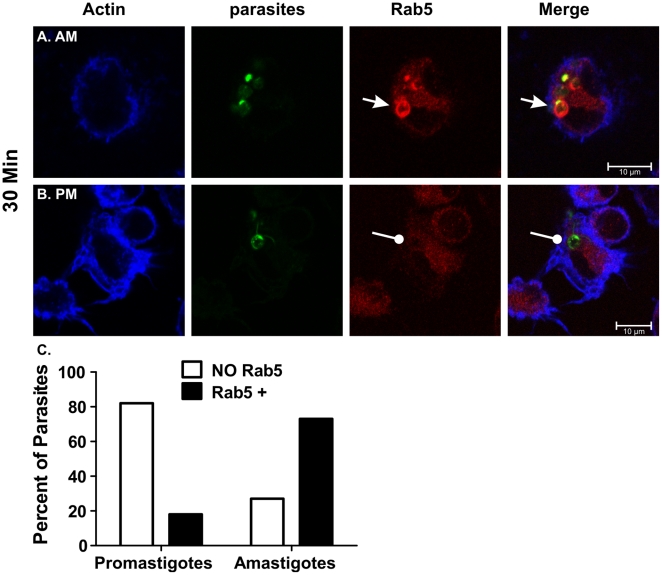
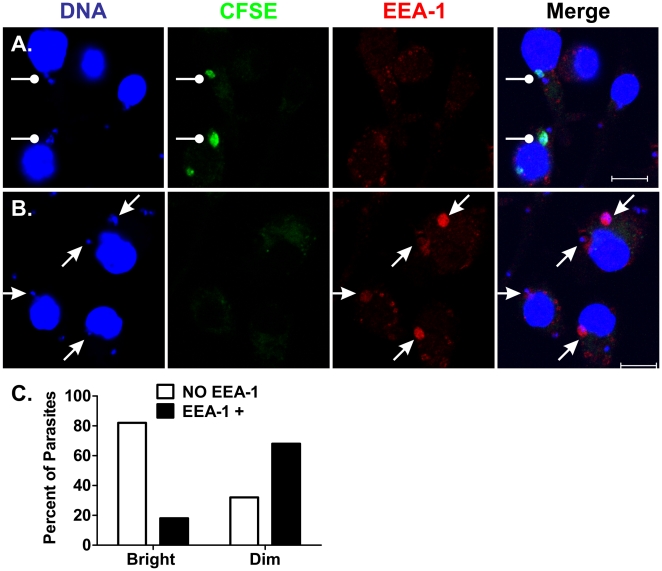
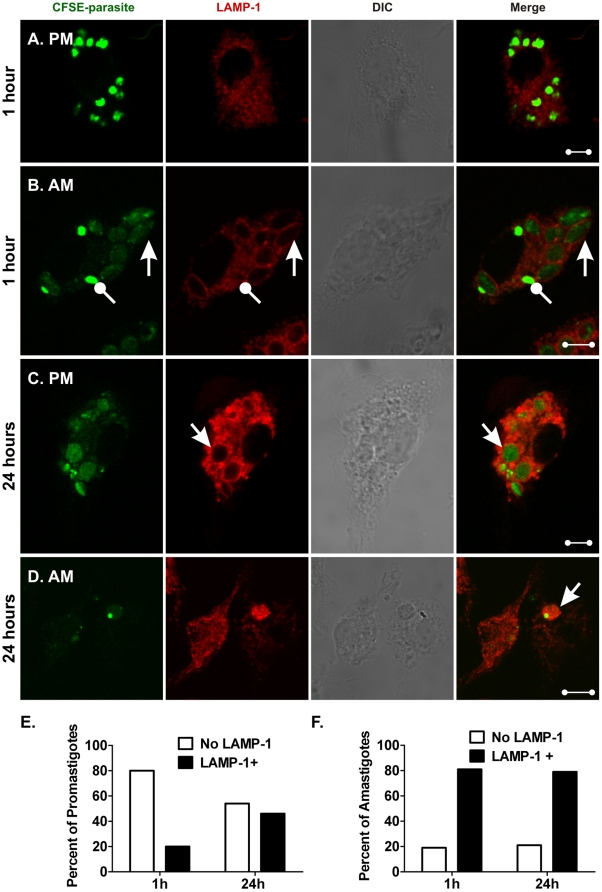
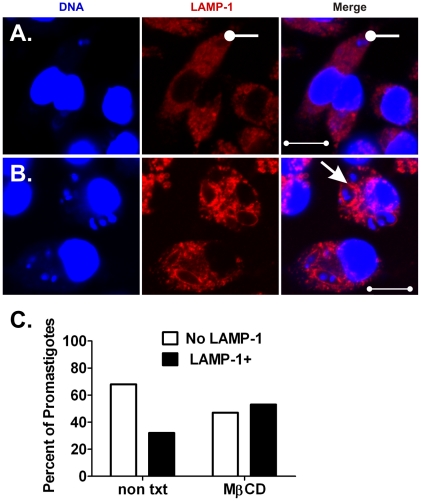
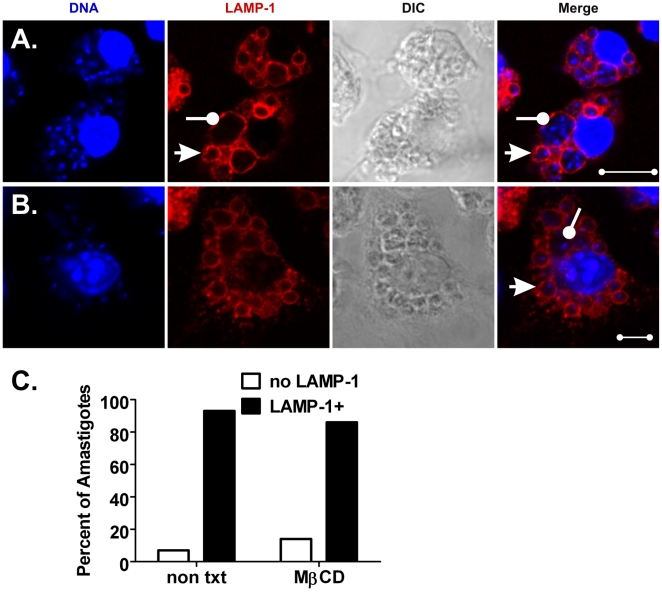
The life stages of Leishmania spp. include the infectious promastigote and the replicative intracellular amastigote. Each stage is phagocytosed by macrophages during the parasite life cycle. We previously showed that caveolae, a subset of cholesterol-rich membrane lipid rafts, facilitate uptake and intracellular survival of virulent promastigotes by macrophages, at least in part, by delaying parasitophorous vacuole (PV)-lysosome fusion. We hypothesized that amastigotes and promastigotes would differ in their route of macrophage entry and mechanism of PV maturation. Indeed, transient disruption of macrophage lipid rafts decreased the entry of promastigotes, but not amastigotes, into macrophages (P<0.001). Promastigote-containing PVs were positive for caveolin-1, and co-localized transiently with EEA-1 and Rab5 at 5 minutes. Amastigote-generated PVs lacked caveolin-1 but retained Rab5 and EEA-1 for at least 30 minutes or 2 hours, respectively. Coinciding with their conversion into amastigotes, the number of promastigote PVs positive for LAMP-1 increased from 20% at 1 hour, to 46% by 24 hours, (P<0.001, Chi square). In contrast, more than 80% of amastigote-initiated PVs were LAMP-1+ at both 1 and 24 hours. Furthermore, lipid raft disruption increased LAMP-1 recruitment to promastigote, but not to amastigote-containing compartments. Overall, our data showed that promastigotes enter macrophages through cholesterol-rich domains like caveolae to delay fusion with lysosomes. In contrast, amastigotes enter through a non-caveolae pathway, and their PVs rapidly fuse with late endosomes but prolong their association with early endosome markers. These results suggest a model in which promastigotes and amastigotes use different mechanisms to enter macrophages, modulate the kinetics of phagosome maturation, and facilitate their intracellular survival.


Conflict of interest statement

Competing Interests: The authors declared that there are no competing interests.

Figures

Figure 1
Figure 1. Cholesterol facilitates the entry and intracellular survival of promastigotes.
Bone marrow macrophages were either left untreated as a control (open bars) or treated with 10 mM for 1 h (solid bars) to transiently deplete cell membrane cholesterol prior to infection. Separate experiments were performed for wild-type and LcJ promastigotes as well as for non-opsonized and 5% A/J serum opsonized parasites. At the indicated times, cells were fixed and stained with Wright-Giemsa and parasite load was assessed by microscopy. Data indicate parasites per 100 macrophages for wild-type metacyclic (A and B) and LcJ (C and D) promastigotes and are the means ± SE of 3 repeats, in triplicates (non-opsonized) or duplicate conditions (serum opsonized). Statistical analysis, (t-test), * P = <0.05, **P = <0.001.
Figure 2
Figure 2. Cholesterol depletion does not affect the entry of amastigotes.
Bone marrow macrophages were either left untreated as a control (open bars) or treated with 10 mM MβCD for 1 h (solid bars) prior to infection. Separate experiments were performed for wild-type and LcJ amastigotes as well as for non-opsonized and 5% A/J serum opsonized parasites. Parasite load and intracellular survival was quantified as described. Data indicate parasites per 100 macrophages for wild-type (A and B) and LcJ (C and D) amastigotes and are the means ± SE of 3 repeats in triplicates (non-opsonized) or duplicate conditions (serum opsonized). Statistical analysis, (t-test), * P = <0.05, ** P = <0.001.
Figure 3
Figure 3. Promastigotes, but not amastigotes, associate with caveolin-1.
Macrophages were incubated with either L. i. chagasi promastigotes (A and B) or amastigotes (C and D). Co-localization of CFSE-labeled parasites (green) with caveolin-1 (red) was assayed by confocal microscopy 1 h after parasite addition. Merged data are shown in the third column, and the fourth column includes Image J “composite and mask” function in which co-localized pixels are shown in white. Images shown are representative of four independent experiments. Scale bar = 10 µm. The “composite and mask” images were used to quantify the proportion of promastigotes or amastigotes that colocalized with caveolin-1 (panel E). A total of 329 promastigotes or 200 amastigotes were examined; differences are statistically significant (p<0,001, Chi Square).
Figure 4
Figure 4. Amastigotes, but not promastigotes retain EEA-1 during infection.
Bone marrow macrophages were infected with either LcJ promastigotes (A, C, and E) or LcJ amastigotes (B, D and F) as described. Samples were fixed, stained and examined by confocal microscopy at 5 min. (A and B), 30 min. (C and D), or 2 h (E and F) after infection. Representative parasites associated with EEA-1 are indicated by arrows, and representative parasites not associated with EEA-1 are marked by wands. Panels A, C and E demonstrate a lack of colocalization of promastigotes with EEA-1. Panel B shows 6 several “dim” amastigotes that co-localized with EEA-1 and three “bright” amastigotes that did not. The one amastigote visualized in Panel D demonstrates co-localization. Panel F shows several clusters of amastigotes. Two out of 3 bright amastigotes and 13 out of 15 dim amastigotes colocalize with EEA-1. Blue: actin; Green: CFSE-stained parasites, Red: EEA-1. Yellow indicates EEA-1/parasite co-localization. Scale bar = 10 µm. Panels G and H: The percentage of promastigotes or amastigotes that associated with EEA-1 was quantified microscopically at either 5 min. (panel G: 119 promastigotes, 123 amastigotes) or 2 h (Panel H: 68 promastigotes, 159 amastigotes) after addition to macrophages. Statistical analysis showed the EEA-1 differential distribution between parasite stages was significant for each time point (p<0.0001 Chi Square).
Figure 5
Figure 5. Rab5 accumulates near amastigotes.
Bone marrow macrophages were infected with LcJ parasites as described. In the initial 30 min. of infection, Rab5 associates with amastigotes (A), but not with promastigotes (B). The percentage of promastigotes or amastigotes associating with Rab5 was quantified for 56 promastigotes and 111 amastigotes (C). Differences were statistically significant (p<0.005, Chi Square). Blue: actin; Green: CFSE-stained parasites, Red: Rab-5. Yellow indicates Rab-5/parasite co-localization. Scale bar = 10 µm.
Figure 6
Figure 6. Differential EEA-1 accumulation between bright and dim amastigotes.
Macrophages were incubated with CFSE-stained amastigotes (green) for 30 minutes at 37°C, 5% CO2. Cells were then stained with TO-PRO-3 (blue) which stained both macrophage and amastigote nuclei, and amastigote kinetoplasts, and stained for EEA-1 (Red). Panels A and B show examples of bright green (CFSE) amastigotes, most of which lacked EEA-1 co-localization (A) and “dim” (faintly or not green) amastigotes, most of which accumulated EEA-1 (B). The proportion of bright or “dim” amastigotes associated with EEA-1 was quantified in 227 amastigotes (C). Differences were statistically significant (p<0.0001, Chi square).
Figure 7
Figure 7. Parasitophorous vacuoles containing promastigotes and amastigotes recruit LAMP-1 with different kinetics.
Macrophages were infected with L. i. chagasi metacyclic promastigotes (A and C) or hamster-derived amastigotes (B and D). Samples were fixed, stained and examined by confocal microscopy after 1 h (A and B) or 24 h (C and D). Images show CFSE-stained parasites in green and LAMP-1 in red. Bright green, LAMP-1-negative amastigotes are marked with a wand, and dim, LAMP-1+ amastigotes are indicated by arrows (B). DIC: differential interference contrast. Scale bar = 5 µm. Images are representative of multiple cells in five replicate experiments. Panels E and F demonstrate graphically the proportions of metacyclic promastigotes (panel E) or hamster-derived amastigotes (panel F) residing in LAMP-1+ or LAMP-1-negative compartments at 1 h or 24 h after parasite inoculation. Numbers were derived from examining 194 promastigotes and 340 amastigotes. Differential distribution of LAMP-1 in promastigote PVs at the two time points (panel E) was statistically significant (P<0.001, Chi square). In contrast, there was no difference between the distribution of LAMP-1 in amastigote PVs at the two time points (panel F), (p = NS, Chi square).
Figure 8
Figure 8. Transient disruption of macrophage lipid rafts accelerates LAMP-1 fusion with promastigote compartments.
Macrophages were either left untreated as a control (A) or treated with 10 mM MβCD for 1 h (B) prior to infection with LcJ promastigotes. After 1 h, samples were fixed and stained for confocal microscopy. Tight, LAMP-1 negative or spacious, LAMP-1+ compartments are marked by wands or arrows, respectively. Data shown are representative of three independent experiments. Blue: TOPRO-3 stained DNA, Red: LAMP-1. Scale bar = 10 µm. (C) Amongst 487 intracellular promastigotes examined, the proportion residing in LAMP-1 negative versus LAMP-1+ compartments was significant (P = <0.001, Chi square).
Figure 9
Figure 9. Fusion of LAMP-1 with amastigotes compartments is independent of lipid raft integrity.
Macrophages were either left untreated as a control (A) or treated with 10 mM MβCD for 1 h (B) and then infected with LcJ amastigotes for 1 h. Fixed cells were processed for confocal microscopy. LAMP-1+ compartments containing single and multiple parasites are indicated by arrows and wands, respectively. Blue: DNA, Red: LAMP-1. Scale bars, (A) = 5 µm; (B) = 10 µm. Panel (C) show a graphical representation of the numbers of amastigotes residing in LAMP-1 negative or LAMP-1+ compartments after examination of 461 or 530 amastigotes from control or treated macrophages, respectively. Differences were not statistically significant between the time points (p = NS, Chi square). Data were derived from three separate experiments.

Similar articles

Cited by

References

    1. Basu MK, Ray M. Macrophage and Leishmania: an unacceptable coexistence. Crit Rev Microbiol. 2005;31:145–154. - PubMed
    1. McConville MJ, de Souza D, Saunders E, Likic VA, Naderer T. Living in a phagolysosome; metabolism of Leishmania amastigotes. Trends Parasitol. 2007;23:368–375. - PubMed
    1. Blackwell JM, Ezekowitz RA, Roberts MB, Channon JY, Sim RB, et al. Macrophage complement and lectin-like receptors bind Leishmania in the absence of serum. J Exp Med. 1985;162:324–331. - PMC - PubMed
    1. Wozencraft AO, Sayers G, Blackwell JM. Macrophage type 3 complement receptors mediate serum-independent binding of Leishmania donovani. Detection of macrophage-derived complement on the parasite surface by immunoelectron microscopy. J Exp Med. 1986;164:1332–1337. - PMC - PubMed
    1. de Freitas Balanco JM, Moreira ME, Bonomo A, Bozza PT, Amarante-Mendes G, et al. Apoptotic mimicry by an obligate intracellular parasite downregulates macrophage microbicidal activity. Curr Biol. 2001;11:1870–1873. - PubMed

Publication types