

Infrared and Raman spectroscopic studies of the antimicrobial effects of garlic concentrates and diallyl constituents on foodborne pathogens
- PMID: 21553849
- PMCID: PMC3433400
- DOI: 10.1021/ac2001498
Infrared and Raman spectroscopic studies of the antimicrobial effects of garlic concentrates and diallyl constituents on foodborne pathogens
Abstract
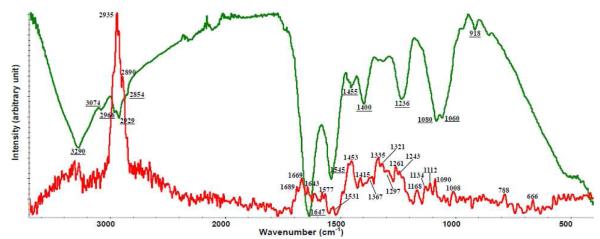
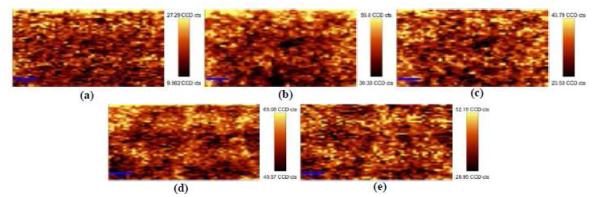
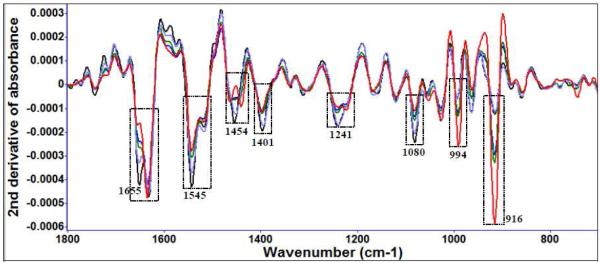
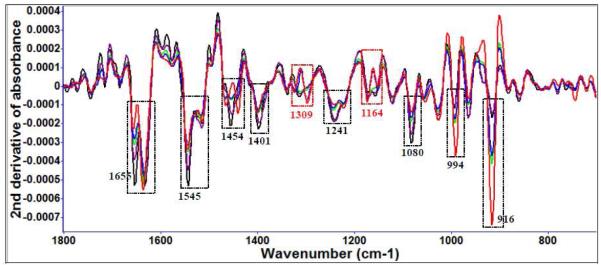
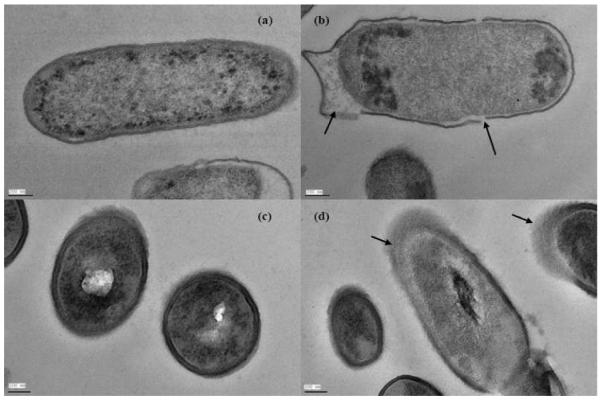
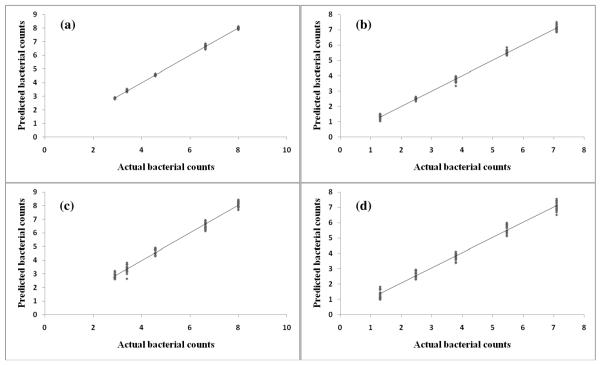
The antimicrobial effects of garlic (Allium sativum) extract (25, 50, 75, 100, and 200 μL/ml) and diallyl sulfide (5, 10, and 20 μM) on Listeria monocytogenes and Escherichia coli O157:H7 cultivated in tryptic soy broth at 4, 22, and 35 °C for up to 7 days were investigated. L. monocytogenes was more resistant to garlic extract and diallyl compounds treatment than E. coli O157:H7. Fourier transform infrared (FT-IR) spectroscopy indicated that diallyl constituents contributed more to the antimicrobial effect than phenolic compounds. This effect was verified by Raman spectroscopy and Raman mapping on single bacteria. Scanning electron microscope (SEM) and transmission electron microscope (TEM) showed cell membrane damage consistent with spectroscopic observation. The degree of bacterial cell injury could be quantified using chemometric methods.
Figures

Similar articles
-
Investigating antibacterial effects of garlic (Allium sativum) concentrate and garlic-derived organosulfur compounds on Campylobacter jejuni by using Fourier transform infrared spectroscopy, Raman spectroscopy, and electron microscopy.Appl Environ Microbiol. 2011 Aug;77(15):5257-69. doi: 10.1128/AEM.02845-10. Epub 2011 Jun 3. Appl Environ Microbiol. 2011. PMID: 21642409 Free PMC article.
-
Diallyl sulfide content and antimicrobial activity against food-borne pathogenic bacteria of chives (Allium schoenoprasum).Biosci Biotechnol Biochem. 2008 Nov;72(11):2987-91. doi: 10.1271/bbb.80482. Epub 2008 Nov 7. Biosci Biotechnol Biochem. 2008. PMID: 18997412
-
The role of diallyl sulfides and dipropyl sulfides in the in vitro antimicrobial activity of the essential oil of garlic, Allium sativum L., and leek, Allium porrum L.Phytother Res. 2013 Mar;27(3):380-3. doi: 10.1002/ptr.4725. Epub 2012 May 21. Phytother Res. 2013. PMID: 22610968
-
Garlic and Gaseous Mediators.Trends Pharmacol Sci. 2018 Jul;39(7):624-634. doi: 10.1016/j.tips.2018.03.009. Epub 2018 Apr 26. Trends Pharmacol Sci. 2018. PMID: 29706261 Review.
-
Anticancer effects of diallyl trisulfide derived from garlic.Asia Pac J Clin Nutr. 2008;17 Suppl 1:249-52. Asia Pac J Clin Nutr. 2008. PMID: 18296348 Review.
Cited by
-
Examination of nanoparticle inactivation of Campylobacter jejuni biofilms using infrared and Raman spectroscopies.J Appl Microbiol. 2012 Oct;113(4):952-63. doi: 10.1111/j.1365-2672.2012.05373.x. Epub 2012 Jul 25. J Appl Microbiol. 2012. PMID: 22734855 Free PMC article.
-
In Vitro Antibacterial Mechanism of Action of Crude Garlic (Allium sativum) Clove Extract on Selected Probiotic Bifidobacterium Species as Revealed by SEM, TEM, and SDS-PAGE Analysis.Probiotics Antimicrob Proteins. 2014 Jun;6(2):82-7. doi: 10.1007/s12602-013-9145-z. Probiotics Antimicrob Proteins. 2014. PMID: 24676721
-
Antibacterial Properties of Organosulfur Compounds of Garlic (Allium sativum).Front Microbiol. 2021 Jul 27;12:613077. doi: 10.3389/fmicb.2021.613077. eCollection 2021. Front Microbiol. 2021. PMID: 34394014 Free PMC article. Review.
-
Comprehensive detection and discrimination of Campylobacter species by use of confocal micro-Raman spectroscopy and multilocus sequence typing.J Clin Microbiol. 2012 Sep;50(9):2932-46. doi: 10.1128/JCM.01144-12. Epub 2012 Jun 27. J Clin Microbiol. 2012. PMID: 22740711 Free PMC article.
-
Investigating the responses of Cronobacter sakazakii to garlic-drived organosulfur compounds: a systematic study of pathogenic-bacterium injury by use of high-throughput whole-transcriptome sequencing and confocal micro-raman spectroscopy.Appl Environ Microbiol. 2014 Feb;80(3):959-71. doi: 10.1128/AEM.03460-13. Epub 2013 Nov 22. Appl Environ Microbiol. 2014. PMID: 24271174 Free PMC article.
References
Publication types
MeSH terms
Substances
Grants and funding
LinkOut - more resources
Full Text Sources
Molecular Biology Databases
