

Anxiety and fear in a cross of C57BL/6J and DBA/2J mice: mapping overlapping and independent QTL for related traits
- PMID: 21554534
- PMCID: PMC3756832
- DOI: 10.1111/j.1601-183X.2011.00699.x
Anxiety and fear in a cross of C57BL/6J and DBA/2J mice: mapping overlapping and independent QTL for related traits
Abstract
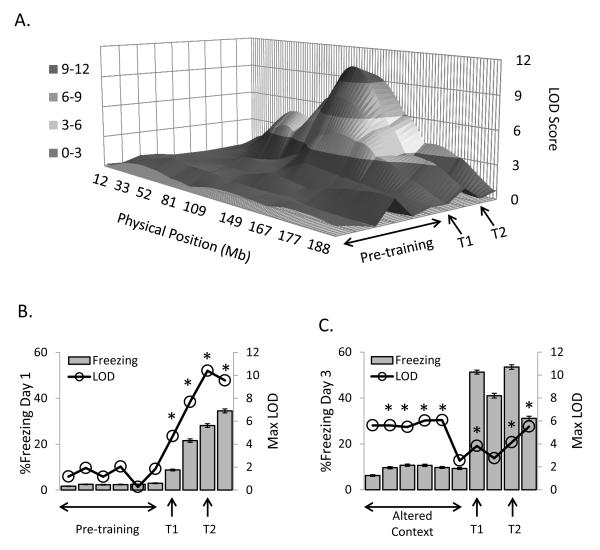
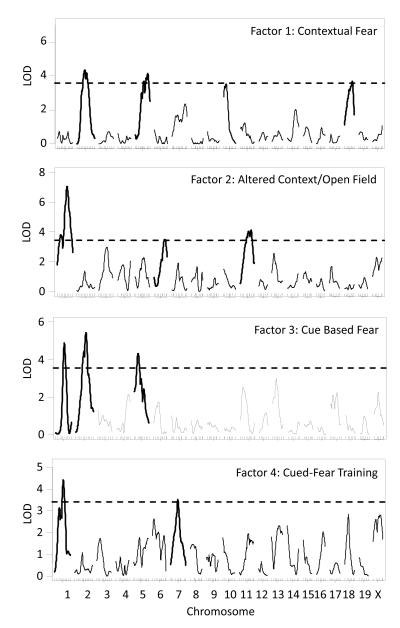
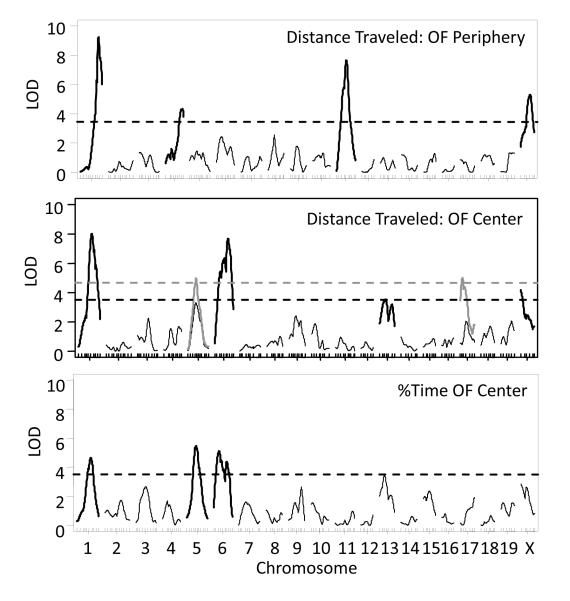
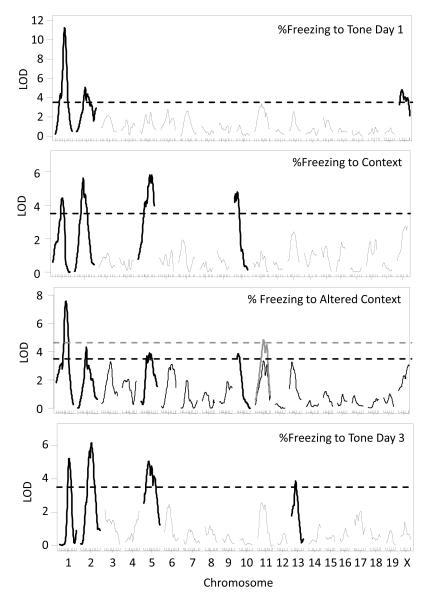
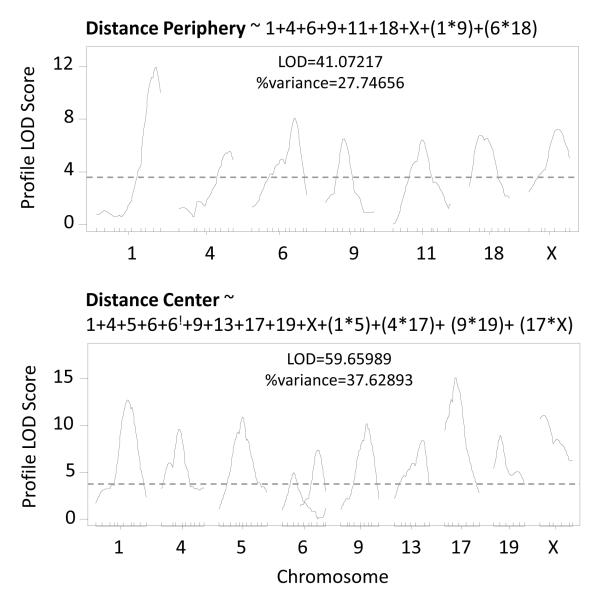
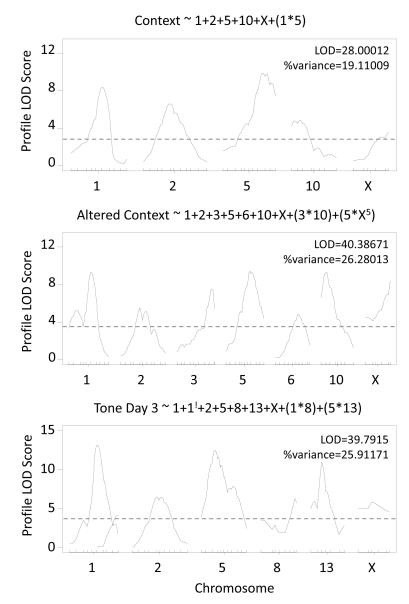
Anxiety, like other psychiatric disorders, is a complex neurobehavioral trait, making identification of causal genes difficult. In this study, we examined anxiety-like behavior and fear conditioning (FC) in an F(2) intercross of C57BL/6J and DBA/2J mice. We identified numerous quantitative trait loci (QTL) influencing anxiety-like behavior in both open field (OF) and FC tests. Many of these QTL were mapped back to the same chromosomal regions, regardless of behavior or test. For example, highly significant overlapping QTL on chromosome 1 were found in all FC measures as well as in center time measures in the OF. Other QTL exhibited strong temporal profiles over testing, highlighting dynamic relationship between genotype, test and changes in behavior. Next, we implemented a factor analysis design to account for the correlated nature of the behaviors measured. OF and FC behaviors loaded onto four main factors representing both anxiety and fear behaviors. Using multiple QTL modeling, we calculated the percentage variance in anxiety and fear explained by multiple QTL using both additive and interactive terms. Quantitative trait loci modeling resulted in a broad description of the genetic architecture underlying anxiety and fear accounting for 14-37% of trait variance. Factor analysis and multiple QTL modeling showed both unique and shared QTL for anxiety and fear; suggesting a partially overlapping genetic architecture for these two different models of anxiety.
© 2011 The Authors. Genes, Brain and Behavior © 2011 Blackwell Publishing Ltd and International Behavioural and Neural Genetics Society.
Figures
References
-
- Broman KW, Wu H, Sen Ś , Churchill GA. R/qtl: QTL mapping in experimental crosses. Bioinformatics. 2003;19:889–890. - PubMed
-
- Broman KW, Sen S. A Guide to QTL Mapping with R/qtl. Springer; New York, NY: 2009.
-
- Brown JS, Kalish HI, Farber IE. Conditioned fear as revealed by magnitude of startle response to an auditory stimulus. Exp Psychol. 1951;41:317–328. - PubMed
Publication types
MeSH terms
Grants and funding
- U01CA105417/CA/NCI NIH HHS/United States
- P20 DA021131/DA/NIDA NIH HHS/United States
- U01AA014425/AA/NIAAA NIH HHS/United States
- U01 AA013499/AA/NIAAA NIH HHS/United States
- U01 AA014425/AA/NIAAA NIH HHS/United States
- P20-DA 21131/DA/NIDA NIH HHS/United States
- U01 AA013513/AA/NIAAA NIH HHS/United States
- 5R01MH079103/MH/NIMH NIH HHS/United States
- U24 RR021760/RR/NCRR NIH HHS/United States
- U24AA13513/AA/NIAAA NIH HHS/United States
- U01 CA105417/CA/NCI NIH HHS/United States
- R01 MH079103/MH/NIMH NIH HHS/United States
- R01 DA021336/DA/NIDA NIH HHS/United States
- U01AA13499/AA/NIAAA NIH HHS/United States
LinkOut - more resources
Full Text Sources
Medical
Molecular Biology Databases
Research Materials
Miscellaneous
