. 2011 May 9:11:115.
doi: 10.1186/1471-2334-11-115.

Reconstructing the 2003/2004 H3N2 influenza epidemic in Switzerland with a spatially explicit, individual-based model

Affiliations

Reconstructing the 2003/2004 H3N2 influenza epidemic in Switzerland with a spatially explicit, individual-based model

Timo Smieszek et al. BMC Infect Dis. .

Abstract

world has not faced a severe pandemic for decades, except the rather mild H1N1 one in 2009, pandemic influenza models are inherently hypothetical and validation is, thus, difficult. We aim at reconstructing a recent seasonal influenza epidemic that occurred in Switzerland and deem this to be a promising validation strategy for models of influenza spread.

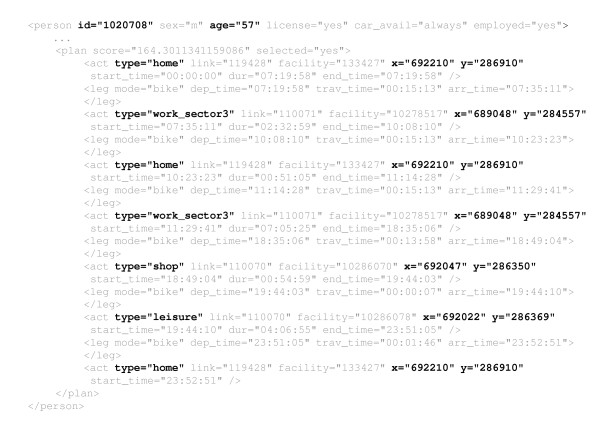
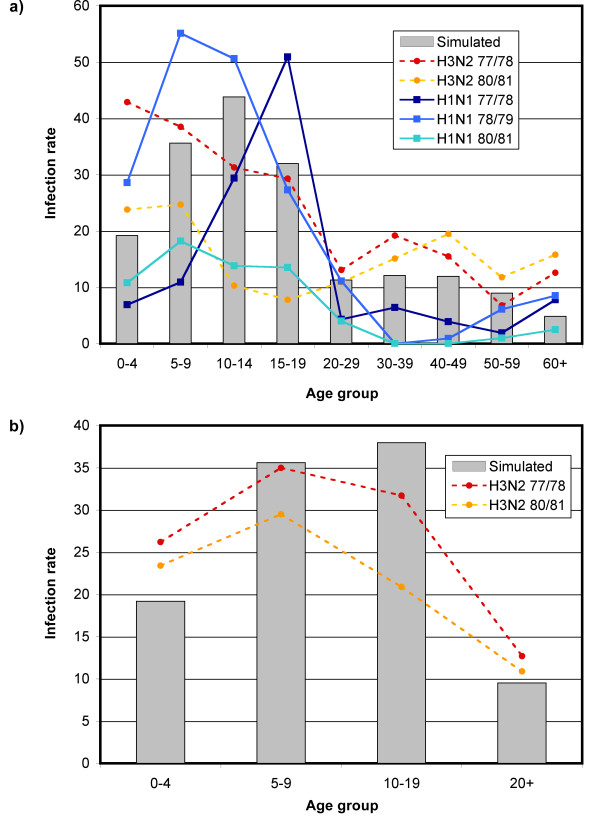
Methods: We present a spatially explicit, individual-based simulation model of influenza spread. The simulation model bases upon (i) simulated human travel data, (ii) data on human contact patterns and (iii) empirical knowledge on the epidemiology of influenza. For model validation we compare the simulation outcomes with empirical knowledge regarding (i) the shape of the epidemic curve, overall infection rate and reproduction number, (ii) age-dependent infection rates and time of infection, (iii) spatial patterns.

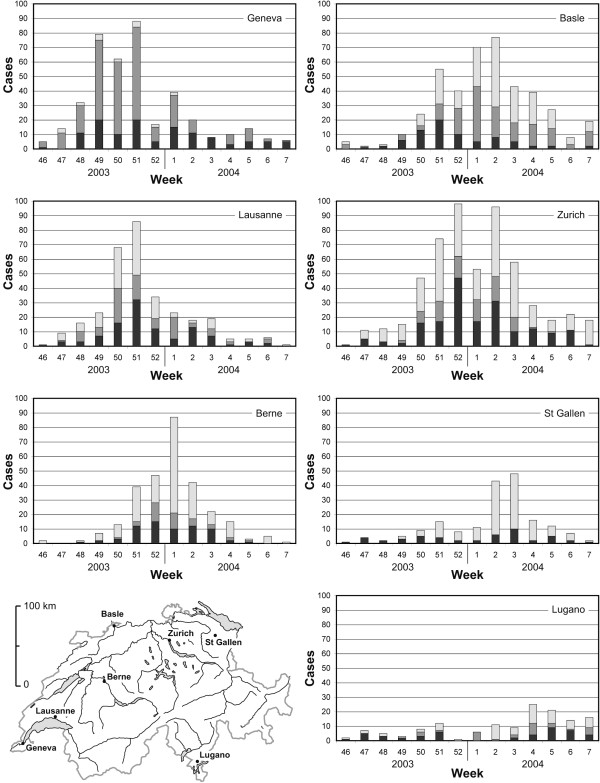
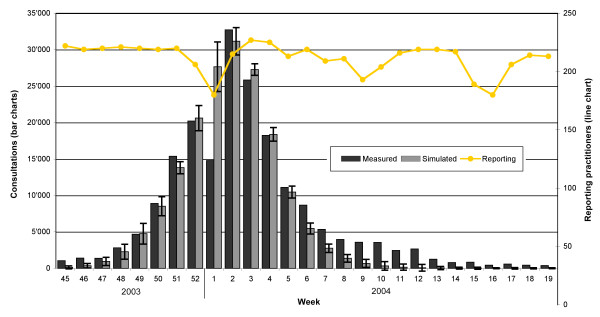
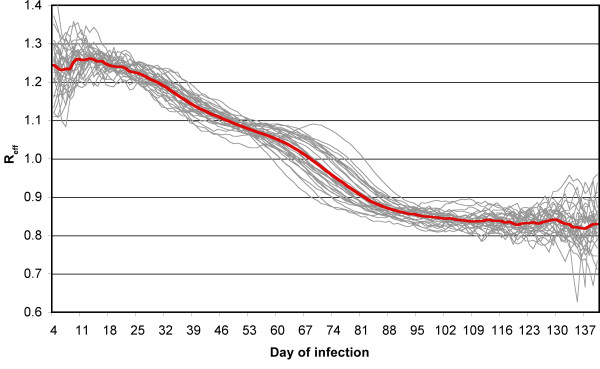
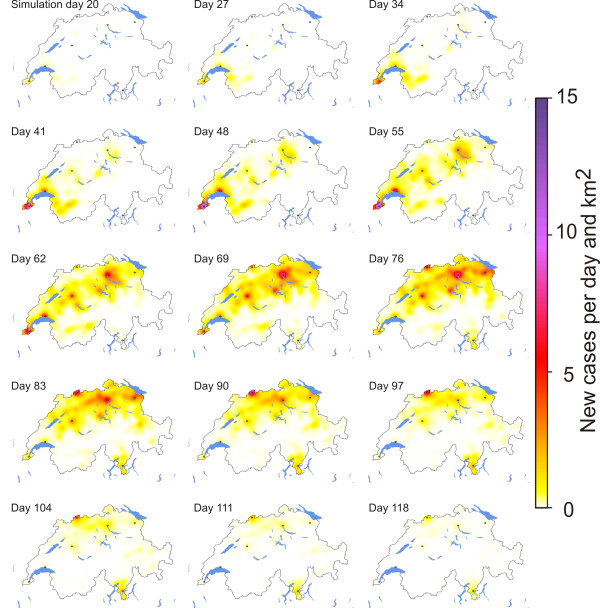
Results: The simulation model is capable of reproducing the shape of the 2003/2004 H3N2 epidemic curve of Switzerland and generates an overall infection rate (14.9 percent) and reproduction numbers (between 1.2 and 1.3), which are realistic for seasonal influenza epidemics. Age and spatial patterns observed in empirical data are also reflected by the model: Highest infection rates are in children between 5 and 14 and the disease spreads along the main transport axes from west to east.

Conclusions: We show that finding evidence for the validity of simulation models of influenza spread by challenging them with seasonal influenza outbreak data is possible and promising. Simulation models for pandemic spread gain more credibility if they are able to reproduce seasonal influenza outbreaks. For more robust modelling of seasonal influenza, serological data complementing sentinel information would be beneficial.


Figures

Figure 1
Figure 1
Reported cases of seven Swiss cities and their hinterland. The figure shows the reported cases of (i) seven Swiss cities (black bars); (ii) municipalities, whose centre is in a range of 7.5 km from the centre of the respective city (dark grey bars); (iii) municipalities with a centre in the range of 15 km (light grey bars)
Figure 2
Figure 2
Epidemic curves and reporting practitioners. The dark grey bars show the extrapolated reported cases coming from the Swiss sentinel system. The light grey bars show the average simulated number of cases. The whiskers represent the standard deviation. The orange line stands for the number of reporting practitioners during the course of time.
Figure 3
Figure 3
MATSim output - Sequence of activities. This figure shows an excerpt of the XML data structure generated by MATSim. The highlighted information is used in the here presented influenza model: id refers to an existing unique identifier in the Swiss census; age gives the age in years of the respective agent; every activity has a type - we distinguish home, work, education, shop and leisure; x and y are coordinates and refer to the Swiss military grid.
Figure 4
Figure 4
Reproduction number versus time of infection. The grey lines show the development of the reproduction number (defined as the average number of secondary cases) of each individual simulation run. The red line is the average of all runs. The abscissa represents the time-point (in days) when an infector started shedding.
Figure 5
Figure 5
Age-dependent infection rates. Subfigure a: The lines show the serological age-dependent infection rates measured for five influenza seasons in Tecumseh, Michigan [86]; the bars show the corresponding average infection rates of our simulation model. Subfigure b: The lines show the serological age-dependent infection rates measures for two influenza seasons in Seattle, Washington [87]; the bars show the corresponding simulated infection rates.
Figure 6
Figure 6
Simulated spatial outbreak patterns. This figure shows the prevalence of influenza in the course of simulation time for one simulation run.

Similar articles

Cited by

References

    1. Bonmarin I, Levy-Bruhl D. Apport des modélisations des épidémies dans la décision de santé publique: exemple de la pandémie grippale. Méd Mal Infect. 2007;37:S204–S209. - PubMed
    1. Eynard F, Koch D, Birrer A, Boubaker K, Matter HC, Raeber PA, Influenza Working Group (AGI) In: Swiss influenza pandemic plan: Strategies and measures in preparation for an influenza pandemic. Bern, CH, editor. Bundesamt für Gesundheit (BAG); 2009. January 2009.
    1. Eichner M, Schwehm M, Wilson N, Baker MG. Small islands and pandemic influenza: potential benefits and limitations of travel volume reduction as a border control measure. BMC Infect Dis. 2009;9:160. doi: 10.1186/1471-2334-9-160. - DOI - PMC - PubMed
    1. Arino J, Brauer F, van den Driessche P, Watmough J, Wu J. A model for influenza with vaccination and antiviral treatment. J Theor Biol. 2008;253:118–130. doi: 10.1016/j.jtbi.2008.02.026. - DOI - PubMed
    1. Carpenter C, Sattenspiel L. The design and use of an agent-based model to simulatie the 1918 influenza epidemic at Norway House, Manitoba. Am J Hum Biol. 2009;21:290–300. doi: 10.1002/ajhb.20857. - DOI - PubMed

Publication types