. 2011 May 9:12:140.
doi: 10.1186/1471-2105-12-140.

Biomarker discovery and redundancy reduction towards classification using a multi-factorial MALDI-TOF MS T2DM mouse model dataset

Affiliations

Biomarker discovery and redundancy reduction towards classification using a multi-factorial MALDI-TOF MS T2DM mouse model dataset

Chris Bauer et al. BMC Bioinformatics. .

Abstract

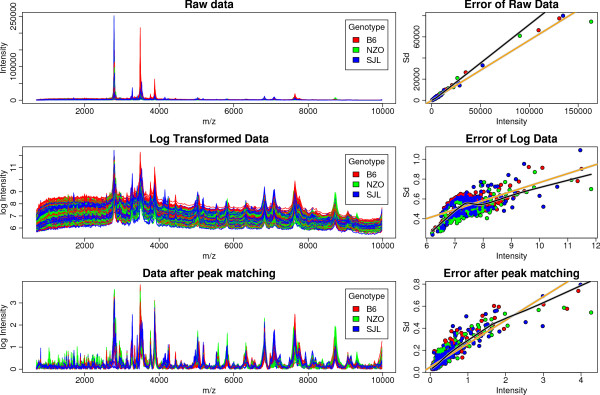
Background: Diabetes like many diseases and biological processes is not mono-causal. On the one hand multi-factorial studies with complex experimental design are required for its comprehensive analysis. On the other hand, the data from these studies often include a substantial amount of redundancy such as proteins that are typically represented by a multitude of peptides. Coping simultaneously with both complexities (experimental and technological) makes data analysis a challenge for Bioinformatics.

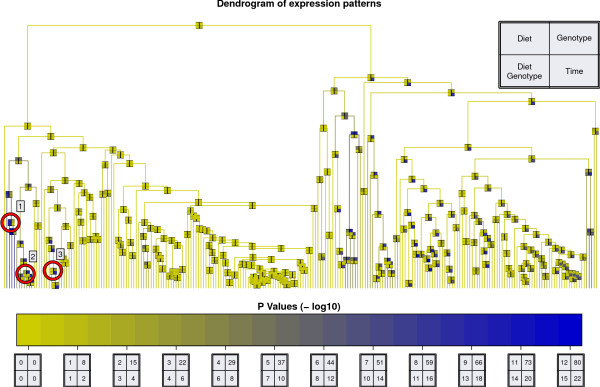
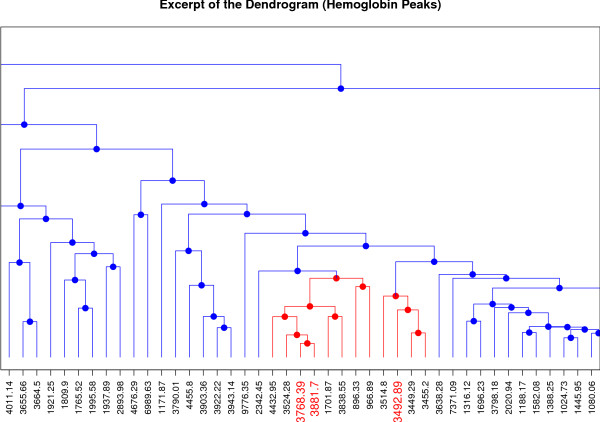
Results: We present a comprehensive work-flow tailored for analyzing complex data including data from multi-factorial studies. The developed approach aims at revealing effects caused by a distinct combination of experimental factors, in our case genotype and diet. Applying the developed work-flow to the analysis of an established polygenic mouse model for diet-induced type 2 diabetes, we found peptides with significant fold changes exclusively for the combination of a particular strain and diet. Exploitation of redundancy enables the visualization of peptide correlation and provides a natural way of feature selection for classification and prediction. Classification based on the features selected using our approach performs similar to classifications based on more complex feature selection methods.

Conclusions: The combination of ANOVA and redundancy exploitation allows for identification of biomarker candidates in multi-dimensional MALDI-TOF MS profiling studies with complex experimental design. With respect to feature selection our method provides a fast and intuitive alternative to global optimization strategies with comparable performance. The method is implemented in R and the scripts are available by contacting the corresponding author.


Figures

Figure 1
Figure 1
Work-flow. Complete work-flow of the cluster-based ANOVA approach with feature selection for multi-factorial MALDI MS profiling data in biomarker discovery.
Figure 2
Figure 2
Preprocessing. MALDI MD profiling raw data (top), log data (middle) and after baseline correction and peak alignment (buttom). The left column show the effect on the spectra itself while the right column shows the corresponding standard error plots including linear fit (orange line) and lowess fit (black line). The different colors reflect different genotypes (red: B6, green: NZO, blue: SJL).
Figure 3
Figure 3
Error Plot to ensure homoscedasticity. Error plot after log transformation to ensure homoscedasticity including linear fit (orange line) and lowess fit (black line). The different colors reflect different genotypes (red: B6, green: NZO, blue: SJL).
Figure 4
Figure 4
Cluster Dendrogram. Cluster dendrogram of all peaks identified in this dataset (see the Methods section for details). Every node is characterized by four ANOVA p-values shown as a color-coded box with four fields: diet (upper left), genotype (upper right), time (lower right) and combination of diet and genotype (lower left). The different -log10 p-value colorscales for the four factors are shown at the bottom. Three clusters for further discussion (see text) are marked with red circles.
Figure 5
Figure 5
Dendrogram Hemoglobin. Excerpt of the dendrogram in Figure 4 showing the three peaks identified as hemoglobin (colored red on the x-axis).
Figure 6
Figure 6
Peak 4075. Normalized peak intensities for the peak at m/z 4075 representing cluster 1 of the dendrogram in Figure 4. Peak intensities for all 3 experimental factors are drawn as bar plots with error-of-mean error bars. Genotype and diet are given below the bars for each week. The missing values for the SJL-HFD week 3 and 4 samples are due to the sample collection problems described in the Methods section.

Similar articles

Cited by

References

    1. Shaw JE, Sicree RA, Zimmet PZ. Global estimates of the prevalence of diabetes for 2010 and 2030. Diabetes Res Clin Pract. 2010;87:4–14. doi: 10.1016/j.diabres.2009.10.007. - DOI - PubMed
    1. Zhang P, Zhang X, Brown J, Vistisen D, Sicree R, Shaw J, Nichols G. Global healthcare expenditure on diabetes for 2010 and 2030. Diabetes Res Clin Pract. 2010;87:293–301. doi: 10.1016/j.diabres.2010.01.026. - DOI - PubMed
    1. Tiffin N, Adie E, Turner F, Brunner HG, van Driel MA, Oti M, Lopez-Bigas N, Ouzounis C, Perez-Iratxeta C, Andrade-Navarro MA, Adeyemo A, Patti ME, Semple CA, Hide W. Computational disease gene identification: a concert of methods prioritizes type 2 diabetes and obesity candidate genes. Nucleic Acids Res. 2006;34:3067–3081. doi: 10.1093/nar/gkl381. - DOI - PMC - PubMed
    1. Rasche A, Al-Hasani H, Herwig R. Meta-analysis approach identifies candidate genes and associated molecular networks for type-2 diabetes mellitus. BMC Genomics. 2008;9:310. doi: 10.1186/1471-2164-9-310. - DOI - PMC - PubMed
    1. Liu X, Feng Q, Chen Y, Zuo J, Gupta N, Chang Y, Fang F. Proteomics-based identification of differentially-expressed proteins including galectin-1 in the blood plasma of type 2 diabetic patients. J Proteome Res. 2009;8:1255–1262. doi: 10.1021/pr800850a. - DOI - PubMed

Publication types