. 2011 May 9:12:141.
doi: 10.1186/1471-2105-12-141.

Inferring functional modules of protein families with probabilistic topic models

Affiliations

Inferring functional modules of protein families with probabilistic topic models

Sebastian Ga Konietzny et al. BMC Bioinformatics. .

Abstract

Background: Genome and metagenome studies have identified thousands of protein families whose functions are poorly understood and for which techniques for functional characterization provide only partial information. For such proteins, the genome context can give further information about their functional context.

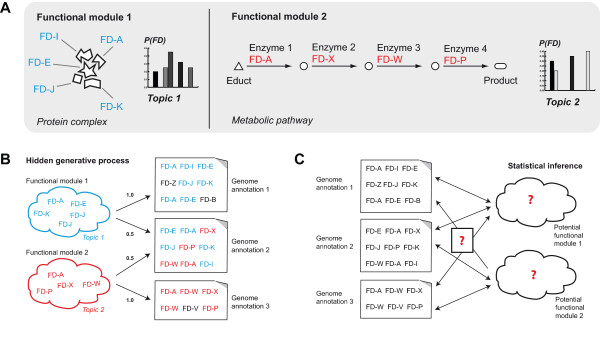
Results: We describe a Bayesian method, based on a probabilistic topic model, which directly identifies functional modules of protein families. The method explores the co-occurrence patterns of protein families across a collection of sequence samples to infer a probabilistic model of arbitrarily-sized functional modules.

Conclusions: We show that our method identifies protein modules - some of which correspond to well-known biological processes - that are tightly interconnected with known functional interactions and are different from the interactions identified by pairwise co-occurrence. The modules are not specific to any given organism and may combine different realizations of a protein complex or pathway within different taxa.


Figures

Figure 1
Figure 1
The LDA model assumes a hidden generative process that can be inversed for statistical inference. In our approach, topics are assumed to represent the unknown biological modules that have shaped the contents of genomes. As a simplifying example, the influence of two modules on the contents of three genome annotations is considered. Panel A: Functional descriptors (FD terms) are associated with proteins in the modules, and each module is represented by a probability distribution over FD terms. Panel B: The hidden generative process: Genome annotations are assumed to be generated from weighted mixtures of the probability distributions. The two clouds show the FD term set with the highest probabilities for each module. Note that the second genome annotation is equally shaped by both modules, whereas the other two annotations are solely shaped by one module. Panel C: The input data as seen by our method. No a priori knowledge about the underlying modules is necessary. The potential functional modules are latent variables of the model that will be inferred from the collection. The identified modules are not necessarily specific to any given microbe, but potentially combine different realizations of a complex or pathway from different organisms.
Figure 2
Figure 2
Overview of the STRING-based evaluation of 198 modules. We evaluated 198 PF-modules from a randomly chosen run with k = 200. Coverage values for the modules serve to assess their functional coherence. A coverage value of 100% means that the complete OG set of a module is interconnected within the reference functional network and forms a single cluster therein. If the coverage is 50%, then the same holds for half of the OGs of a module. The plot shows coverage values for all 198 modules of the exemplary run (modules 'ChemoTax', 'Flagell' and 'VitB12' are discussed in detail in the Results section). 'Verified-PWF-couplings': The percentage of verified pairwise functional couplings with respect to all tested OG pairs of a module. 'Verified-PWF-couplings + Verified-TRF-couplings': The percentage of a module's OG pairs that are either verified pairwise couplings or verified first-order transitive functional couplings. 'Expected verified F-couplings': The expected percentage of verified pairwise couplings to be found by chance for the OG set of a module. For an average-sized module, we expect to obtain less than one (E[h] = 0.19) verified pairwise functional coupling by chance. The dashed lines indicate mean values, and the averaged mean coverage over all nine runs is 57.9% (1.3% s.d.). Finally, we determined the fraction of OG pairs within a module which are verified and have also been predicted by the pairwise co-occurrence method used by STRING.
Figure 3
Figure 3
Evaluation scheme for the inferred potential functional modules. Panel A: A group of 18 OGs, representing an average-sized module. To assess the functional coherence of the module, all possible OG pairs of the module (153 pairs, illustrated as purple lines) are matched against a high confidence reference set of OG pairs from STRING. Panel B: The functional network spanned by the reference OG pairs. Pairwise interactions in the network that are matched by OG pairs of the module are marked as blue edges. In contrast, the majority of linkages in the reference network are marked in gray, indicating that they are not matched by any pair from the module. In each case where three module OGs are exclusively connected by two blue edges, we presume evidence for a transitive relationship (green edges), even though the third edge that completes the triangular relationship is not contained in the reference set. Thus, given the 153 tested pairs, the module yields nine verified pairwise interactions, plus four additional (first-order) transitive interactions. Note that in this case, the module covers three connected components in the network. The five OGs marked with red boundaries are part of the largest connected subcomponent, resulting in a coverage value of 5/18 = 27.8%.
Figure 4
Figure 4
Mapping of the 'Flagell' module to the KEGG map 'flagellar assembly'. OGs of the 'Flagell' module are mapped to the KEGG map. Matched items are highlighted in red. This image is adapted from the original KEGG map.
Figure 5
Figure 5
Pairwise predictions deduced from 198 modules compared with predictions of the co-occurrence baseline method. The Venn diagram visualizes the overlaps between the different OG pair sets. The partitions are defined over OG pairs. For each section of the Venn diagram, the number of distinct OG terms defined as parts of the pairs is noted. Note that the OG sets of the single sections are not necessarily disjoint. A large total of 5,123 pairs have been validated for the modules. Additionally, 7,603 first-order transitive relationships could be validated based on the reference set (not included in the Venn diagram). Based on our estimate E[h] for the expected number h of random matches for a single module, we would expect less than 50 matches to the reference set for the 42,695 tested pairs of the modules by chance.
Figure 6
Figure 6
Visualization of the functional network spanned by the OG pairs of the reference set. The figure shows the pairwise functional interactions defined by the reference set as edges between OGs in a network graph. The subset of verified pairwise predictions from the modules is shown in green, whereas the subset of verified predictions by pairwise co-occurrence profiling is shown in blue. Functional interactions that are predicted by both methods are colored in red, and those not detected by any of the methods are shown in gray.

References

    1. Rubin EM. Genomics of cellulosic biofuels. Nature. 2008;454:841–845. doi: 10.1038/nature07190. - DOI - PubMed
    1. Osterman A, Overbeek R. Missing genes in metabolic pathways: a comparative genomics approach. Curr Opin Chem Biol. 2003;7:238–251. doi: 10.1016/S1367-5931(03)00027-9. - DOI - PubMed
    1. Reed JL, Famili I, Thiele I, Palsson BO. Towards multidimensional genome annotation. Nat Rev Genet. 2006;7:130–141. doi: 10.1038/nrg1769. - DOI - PubMed
    1. Stein L. Genome annotation: from sequence to biology. Nat Rev Genet. 2001;2:493–503. - PubMed
    1. Yooseph S, Sutton G, Rusch DB, Halpern AL, Williamson SJ, Remington K, Eisen JA, Heidelberg KB, Manning G, Li W, Jaroszewski L, Cieplak P, Miller CS, Li H, Mashiyama ST, Joachimiak MP, van Belle C, Chandonia JM, Soergel DA, Zhai Y, Natarajan K, Lee S, Raphael BJ, Bafna V, Friedman R, Brenner SE, Godzik A, Eisenberg D, Dixon JE, Taylor SS. et al.The Sorcerer II Global Ocean Sampling expedition: expanding the universe of protein families. PLoS Biol. 2007;5:e16. doi: 10.1371/journal.pbio.0050016. - DOI - PMC - PubMed

LinkOut - more resources