Iron specificity of a biosensor based on fluorescent pyoverdin immobilized in sol-gel glass
- PMID: 21554740
- PMCID: PMC3114707
- DOI: 10.1186/1754-1611-5-4
Iron specificity of a biosensor based on fluorescent pyoverdin immobilized in sol-gel glass
Abstract
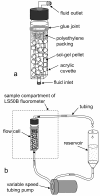
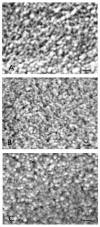
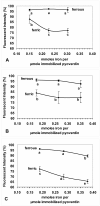
Two current technologies used in biosensor development are very promising: 1. The sol-gel process of making microporous glass at room temperature, and 2. Using a fluorescent compound that undergoes fluorescence quenching in response to a specific analyte. These technologies have been combined to produce an iron biosensor. To optimize the iron (II or III) specificity of an iron biosensor, pyoverdin (a fluorescent siderophore produced by Pseudomonas spp.) was immobilized in 3 formulations of porous sol-gel glass. The formulations, A, B, and C, varied in the amount of water added, resulting in respective R values (molar ratio of water:silicon) of 5.6, 8.2, and 10.8. Pyoverdin-doped sol-gel pellets were placed in a flow cell in a fluorometer and the fluorescence quenching was measured as pellets were exposed to 0.28 - 0.56 mM iron (II or III). After 10 minutes of exposure to iron, ferrous ion caused a small fluorescence quenching (89 - 97% of the initial fluorescence, over the range of iron tested) while ferric ion caused much greater quenching (65 - 88%). The most specific and linear response was observed for pyoverdin immobilized in sol-gel C. In contrast, a solution of pyoverdin (3.0 μM) exposed to iron (II or III) for 10 minutes showed an increase in fluorescence (101 - 114%) at low ferrous concentrations (0.45 - 2.18 μM) while exposure to all ferric ion concentrations (0.45 - 3.03 μM) caused quenching. In summary, the iron specificity of pyoverdin was improved by immobilizing it in sol-gel glass C.
Figures


References
-
- Achterberg EP, Holland TW, Bowie AR, Mantoura RFC, Worsfold PJ. Determination of iron in seawater. Anal Chim Acta. 2001;442:1–14. doi: 10.1016/S0003-2670(01)01091-1. - DOI
-
- Zusman R, Rottman C, Ottolenghi M, Avnir D. Doped sol-gel glasses as chemical sensors. J Non-Cryst Solids. 1990;22:107–109.
-
- Lev O, Kuyavskaya BI, Gigozin I, Ottolenghi M, Avnir D. A high-sensitivity photometric method based on doped sol-gel glass detectors: determination of sub-ppb divalent iron. Fresenius J Anal Chem. 1992;343:370–372. doi: 10.1007/BF00322873. - DOI
-
- Espósito BP, Breuer W, Cabantchik ZI. Design and applications of methods for fluorescence detection of iron in biological systems. Biochem Soc Trans. 2002;30:729–732. - PubMed
LinkOut - more resources
Full Text Sources
Other Literature Sources
Molecular Biology Databases
Miscellaneous

