

Modulation of Pseudomonas aeruginosa surface-associated group behaviors by individual amino acids through c-di-GMP signaling
- PMID: 21554951
- PMCID: PMC3716369
- DOI: 10.1016/j.resmic.2011.04.014
Modulation of Pseudomonas aeruginosa surface-associated group behaviors by individual amino acids through c-di-GMP signaling
Abstract
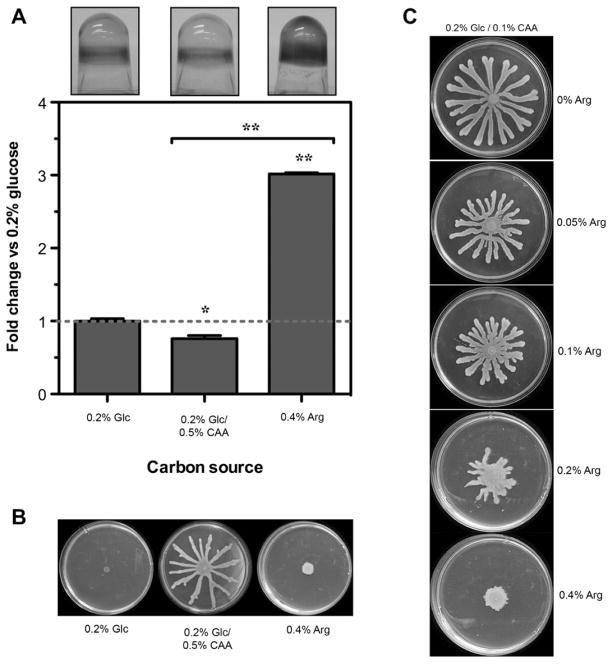
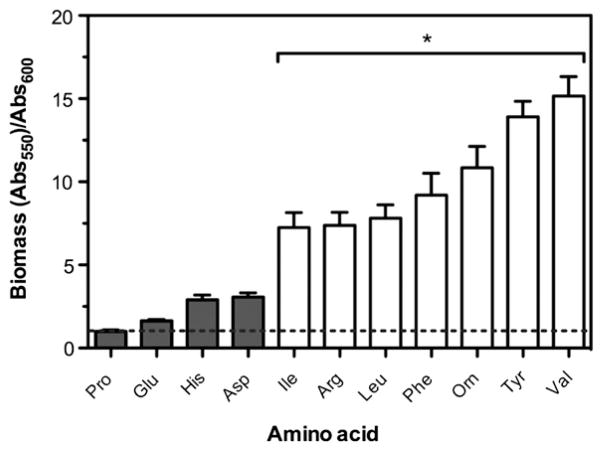
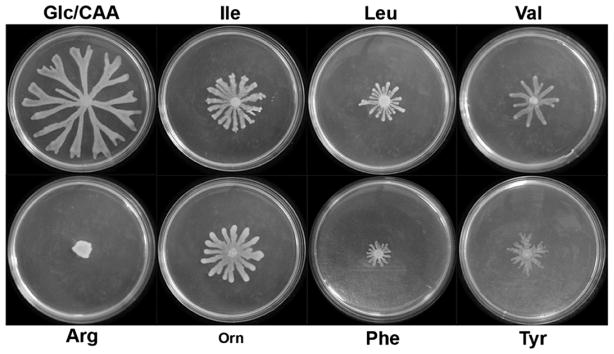
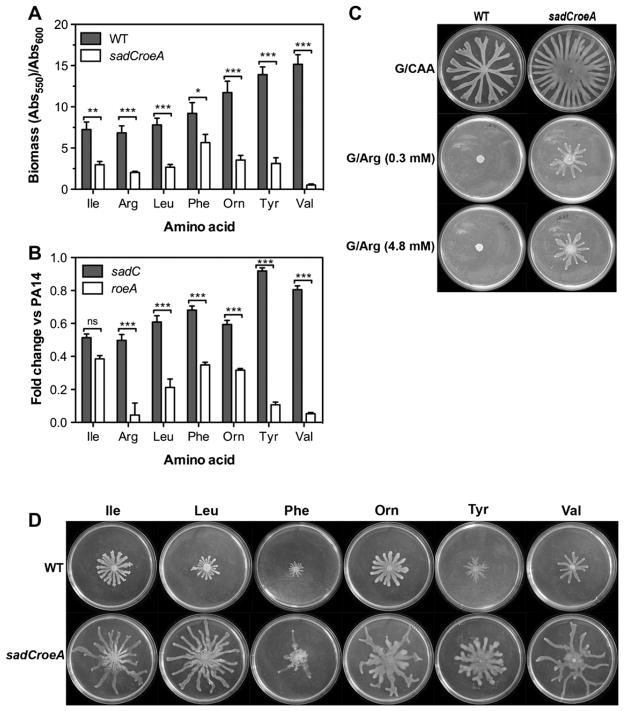
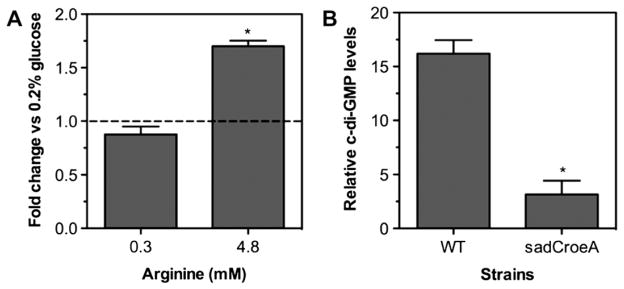
To colonize the cystic fibrosis lung, Pseudomonas aeruginosa establishes sessile communities referred to as biofilms. Although the signaling molecule c-di-GMP governs the transition from motile to sessile growth, the environmental signal(s) required to modulate biofilm formation remain unclear. Using relevant in vivo concentrations of the 19 amino acids previously identified in cystic fibrosis sputum, we demonstrated that arginine, ornithine, isoleucine, leucine, valine, phenylalanine and tyrosine robustly promoted biofilm formation in vitro. Among the seven biofilm-promoting amino acids, only arginine also completely repressed the ability of P. aeruginosa to swarm over semi-solid surfaces, suggesting that arginine may be an environmental cue favoring a sessile lifestyle. Mutating two documented diguanylate cyclases required for biofilm formation (SadC and RoeA) reduced biofilm formation and restored swarming motility on arginine-containing medium. Growth on arginine increased the intracellular levels of c-di-GMP, and this increase was dependent on the SadC and RoeA diguanylate cyclases. Strains mutated in sadC, roeA or both also showed a reduction in biofilm formation when grown with the other biofilm-promoting amino acids. Taken together, these results suggest that amino acids can modulate biofilm formation and swarming motility, at least in part, by controlling the intracellular levels of c-di-GMP.
Copyright © 2011 Institut Pasteur. Published by Elsevier Masson SAS. All rights reserved.
Figures
Similar articles
-
Biofilms and Cyclic di-GMP (c-di-GMP) Signaling: Lessons from Pseudomonas aeruginosa and Other Bacteria.J Biol Chem. 2016 Jun 10;291(24):12547-12555. doi: 10.1074/jbc.R115.711507. Epub 2016 Apr 21. J Biol Chem. 2016. PMID: 27129226 Free PMC article. Review.
-
Specific control of Pseudomonas aeruginosa surface-associated behaviors by two c-di-GMP diguanylate cyclases.mBio. 2010 Oct 19;1(4):e00183-10. doi: 10.1128/mBio.00183-10. mBio. 2010. PMID: 20978535 Free PMC article.
-
The Pseudomonas aeruginosa diguanylate cyclase GcbA, a homolog of P. fluorescens GcbA, promotes initial attachment to surfaces, but not biofilm formation, via regulation of motility.J Bacteriol. 2014 Aug;196(15):2827-41. doi: 10.1128/JB.01628-14. Epub 2014 Jun 2. J Bacteriol. 2014. PMID: 24891445 Free PMC article.
-
Role of Cyclic Di-GMP and Exopolysaccharide in Type IV Pilus Dynamics.J Bacteriol. 2017 Mar 28;199(8):e00859-16. doi: 10.1128/JB.00859-16. Print 2017 Apr 15. J Bacteriol. 2017. PMID: 28167523 Free PMC article.
-
Targeting c-di-GMP Signaling, Biofilm Formation, and Bacterial Motility with Small Molecules.Methods Mol Biol. 2017;1657:419-430. doi: 10.1007/978-1-4939-7240-1_31. Methods Mol Biol. 2017. PMID: 28889311 Review.
Cited by
-
Controlling Biofilm Development Through Cyclic di-GMP Signaling.Adv Exp Med Biol. 2022;1386:69-94. doi: 10.1007/978-3-031-08491-1_3. Adv Exp Med Biol. 2022. PMID: 36258069 Free PMC article. Review.
-
Metabolomics Deciphered Metabolic Reprogramming Required for Biofilm Formation.Sci Rep. 2019 Sep 11;9(1):13160. doi: 10.1038/s41598-019-49603-1. Sci Rep. 2019. PMID: 31511592 Free PMC article.
-
The effect of loss of O-antigen ligase on phagocytic susceptibility of motile and non-motile Pseudomonas aeruginosa.Mol Immunol. 2017 Dec;92:106-115. doi: 10.1016/j.molimm.2017.10.015. Epub 2017 Oct 20. Mol Immunol. 2017. PMID: 29059582 Free PMC article.
-
Biofilms and Cyclic di-GMP (c-di-GMP) Signaling: Lessons from Pseudomonas aeruginosa and Other Bacteria.J Biol Chem. 2016 Jun 10;291(24):12547-12555. doi: 10.1074/jbc.R115.711507. Epub 2016 Apr 21. J Biol Chem. 2016. PMID: 27129226 Free PMC article. Review.
-
Genetic Dissection of the Regulatory Network Associated with High c-di-GMP Levels in Pseudomonas putida KT2440.Front Microbiol. 2016 Jul 20;7:1093. doi: 10.3389/fmicb.2016.01093. eCollection 2016. Front Microbiol. 2016. PMID: 27489550 Free PMC article.
References
-
- Alarcon R, Orellana MS, Neira B, Uribe E, Garcia JR, Carvajal N. Mutational analysis of substrate recognition by human arginase type I–agmatinase activity of the N130D variant. FEBS J. 2006;273:5625–5631. - PubMed
Publication types
MeSH terms
Substances
Grants and funding
LinkOut - more resources
Full Text Sources
Other Literature Sources
