. 2011 May 12;70(3):441-54.
doi: 10.1016/j.neuron.2011.03.022.

Mechanistic logic underlying the axonal transport of cytosolic proteins

Affiliations

Mechanistic logic underlying the axonal transport of cytosolic proteins

David A Scott et al. Neuron. .

Abstract

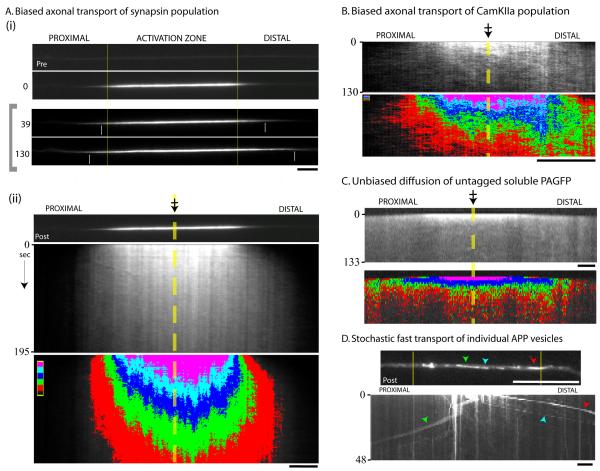
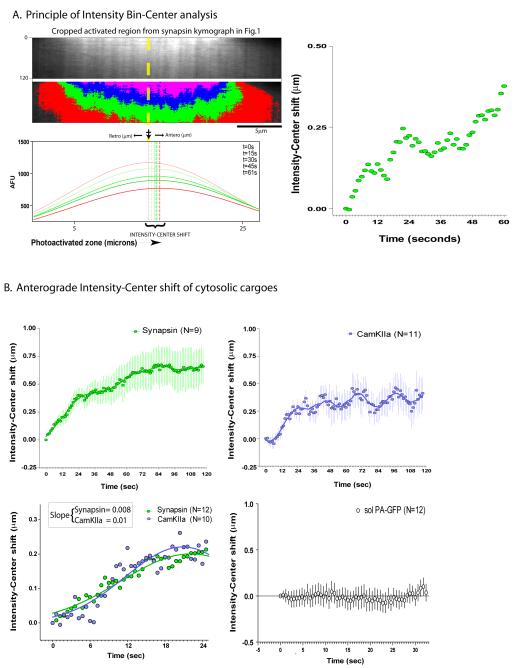
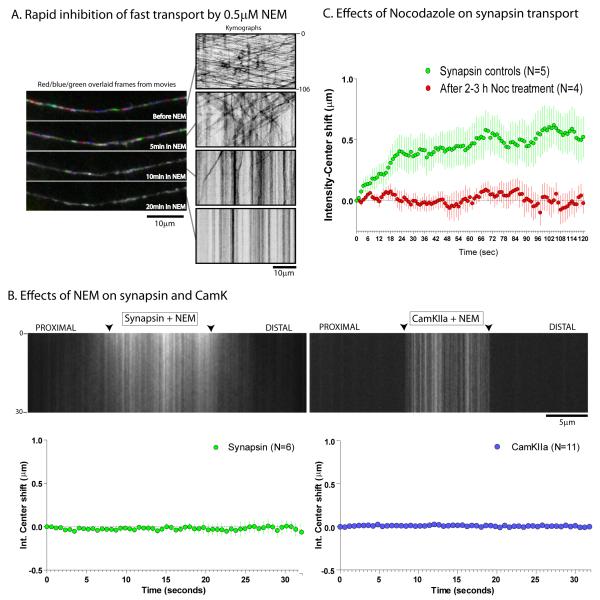
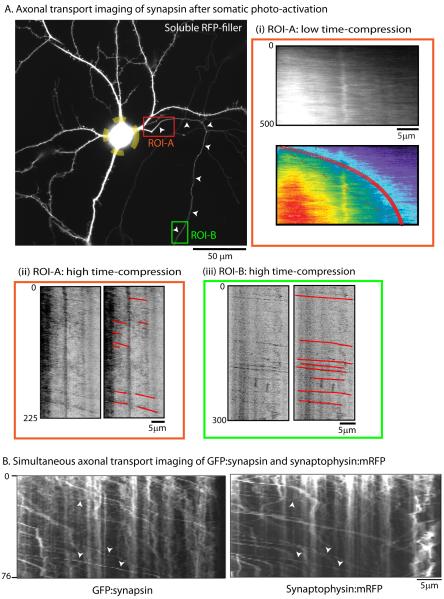
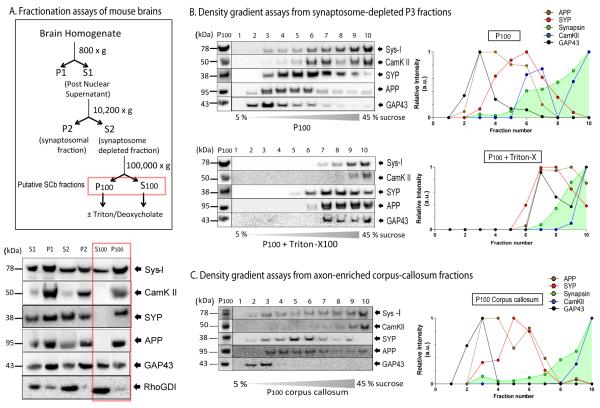
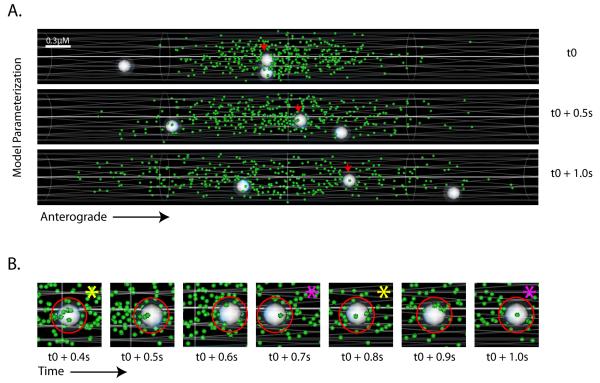
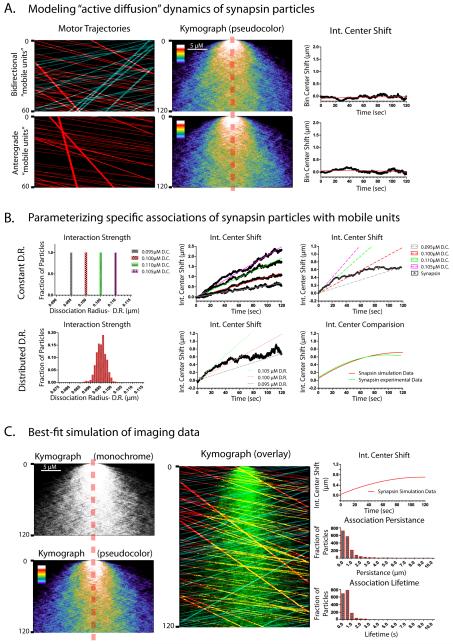
Proteins vital to presynaptic function are synthesized in the neuronal perikarya and delivered into synapses via two modes of axonal transport. While membrane-anchoring proteins are conveyed in fast axonal transport via motor-driven vesicles, cytosolic proteins travel in slow axonal transport via mechanisms that are poorly understood. We found that in cultured axons, populations of cytosolic proteins tagged to photoactivatable GFP (PAGFP) move with a slow motor-dependent anterograde bias distinct from both vesicular trafficking and diffusion of untagged PAGFP. The overall bias is likely generated by an intricate particle kinetics involving transient assembly and short-range vectorial spurts. In vivo biochemical studies reveal that cytosolic proteins are organized into higher order structures within axon-enriched fractions that are largely segregated from vesicles. Data-driven biophysical modeling best predicts a scenario where soluble molecules dynamically assemble into mobile supramolecular structures. We propose a model where cytosolic proteins are transported by dynamically assembling into multiprotein complexes that are directly/indirectly conveyed by motors.


Figures

Figure 1
Figure 1. Axonal transport dynamics of cytosolic proteins
(A) Neurons were co-transfected with PAGFP:synapsin (and soluble mRFP to identify transfected axons); a discrete region within the primary axon was photoactivated, and mobility of the photoactivated protein pool was tracked in living axons by time-lapse imaging. (i) Top: Representative example showing a transfected axon pre- and post- activation. The vertical yellow bars denote the boundaries of the photoactivated zone throughout the frames. Bottom: Selected frames from the time-lapse showing the anterograde migration of the photoactivated plume of fluorescence (time in seconds, left). The small white vertical bars within the images mark the approximate position of the ‘wave-fronts’. Note that the frames within the grey bracket (left) were linearly scaled to maximize the bit-depth within each image and highlight the leading edges of the fluorescent wave-fronts. (ii) Kymograph from the time-lapse above (dashed yellow line and crossed-arrow depicts center of the photoactivated-zone). In the lower panel, the grayscale values of the kymograph above were assigned five pseudo-colored intensity-bins (red: lowest intensity bin, pink: highest intensity bin above background), allowing clear visualization of the anterograde bias of the fluorescent plume. (B) A similar biased transit was seen for the cytosolic protein CamKIIa as shown in these representative images. (C) The movement of untagged PA-GFP was rapid, bidirectional and unbiased. (D) Using a similar photoactivation paradigm, PAGFP:APP vesicles stochastically departed the fluorescent pool over time. Green, blue and red arrowheads mark the position of individual photoactivated vesicles in the post-activation image (above) and the kymograph (below). Scale bars: lower right, elapsed time in seconds: left of kymograph.
Figure 2
Figure 2. Quantitative strategy to analyze the bulk movement of photoactivated protein pools
(A) Top panels show cropped kymographs from the photoactivated zone in figure 1. Each curve below represents average-intensity bins along a line-scan within the photoactivated axonal segment for a given frame (time, upper right key, Gaussian fits shown). Dashed vertical lines represent the position of the peak-value for each intensity curve (intensity-center). Note that there is a left to right (anterograde) shift in the positions of the peaks over time (intensity-center shift). The graph on the right is a plot of the intensity-center shift over time. (B) Quantitative data from multiple synapsin and CamKIIa experiments (mean ± SEM) showing anterograde intensity-center shifts for both protein populations. In the bottom panel the first few seconds after photoactivation was imaged with higher time-compressions (Gaussian fits shown). Predicted average rates of the overall synapsin and CamKIIa population in these experiments (derived from linear-regression slopes) are comparable to known overall rates of synapsin and CamKIIa seen in previous radiolabeling studies (see text). No shifts are seen with untagged PA-GFP (bottom right, mean ± SEM). Each X-axes tick represents an image-acquisition time-point in all graphs. Scale bars: lower right, elapsed time in seconds: left of kymograph.
Figure 3
Figure 3. Biased transport of cytosolic cargoes is distinct from untagged PAGFP and is motor-dependent
(A) To determine the effects of NEM on generic motor-driven transport, neurons were transfected with APP:YFP and transport of APP vesicles was determined before and after adding 0.5μM NEM. Each panel on left is created by overlapping three consecutive time-lapse frames that were pseudo-colored red/blue/green respectively; before (top frame) and at incremental time-points after adding NEM. Corresponding kymographs from the movies are shown on the right. Note that the robust bidirectional vesicular transport was gradually inhibited with NEM-treatment. (B) Neurons transfected with PAGFP:synapsin or PAGFP:CamKIIa were incubated with 0.5mM NEM for 10 minutes and photoactivation experiments were performed as described in text. As shown in the representative kymographs (top), NEM treatment greatly inhibited the overall mobility of the photoactivated pool, leading to stalled fluorescent particles within axons and essentially eliminated the anterograde bias, as shown in the graphs below (mean ± SEM). Scale bars: lower right, elapsed time in seconds: right/left of kymograph. (C) A similar inhibition of the anterograde bias of synapsin was seen upon treatment of neurons with the microtubule-depolymerizing drug Nocodazole (mean ± SEM, p<0.0001, paired t-test).
Figure 4
Figure 4. A subset of rapid and persistent synapsin particles in axons
(A) Neurons were co-transfected with PA-GFP:synapsin and soluble mRFP (to identify morphology, image on left) and the cell-body was selectively photoactivated (dashed yellow circle marks the boundaries of photoactivation-zone; small arrowheads mark the emanating axon). Thereafter, the photoactivated protein pool was imaged as it entered the axon, using varying time-compressions in proximal (ROI-A, red box) and distal (ROI-B, green box) regions. Imaging of the proximal axon in ROI-A at low time-compressions (1 frame/5sec) revealed a slow, anterogradely moving plume of fluorescence matching the known kinetics of slow transport (kymographs in A-I, slope= 0.02, equivalent to average velocity of 0.02μm/sec). However, when the same ROI was imaged at a higher time compression (1 frame/0.75 sec), we also saw rapid, persistent particles emerging from the front of the slowly migrating fluorescence plume (kymographs in A-ii). This was further confirmed by subsequent imaging of a distal portion of the same axon (ROI-B) at the higher frame-rate, where many rapid and persistent particles were clearly seen, moving with an exclusively anterograde bias (kymographs in A-iii). Axonal transport of the fast-component protein APP using a similar paradigm is shown in Supplementary figure 5. (B) Simultaneous imaging of steady-state GFP:synapsin and synaptophysin:mRFP in thin distal axons revealed mostly persistent synapsin particles that co-localized with synaptophysin (arrowheads). Scale bars: lower right, elapsed time in seconds: left of kymograph.
Figure 5
Figure 5. Biochemical analysis of synapsin and CamKII in-vivo from axon-enriched fractions
(A) Mouse brains were homogenized and fractionated as outlined in the experimental strategy on the left, reasoning that axonal synapsin/CamKIIa cargoes would exist within P100 and S100 (derivates of S2, the synaptosome-depleted fractions, boxed in red). Fractions were blotted with antibodies to synapsin (Sys-I) and CamKII as well as the vesicular proteins synaptophysin (SYP), APP and GAP-43. The gel below shows that large proportions of these proteins were also present in the high-speed pellet (P100) indicating that they are not entirely soluble. Note that the presumptively diffusive signaling molecule RhoGDI remains largely in the supernate in such experiments. (B) Top: In density-gradient assays from the P100 fractions, large populations of synapsin and CamKII are found in the high-density fractions 7-10 (P100, top panel) distinct from vesicular proteins. Bottom: Treatment of P100 with Triton attenuated the associations of vesicular proteins with little effect on the higher-density fractions containing synapsin/CamKII. Densitometry analysis of the gels is shown on the right. (C) Similar supernate/pellet proportions and separation of cytosolic and vesicular proteins was observed in density-gradients from axon-enriched corpus-callosum fractions from mouse brains as well.
Figure 6
Figure 6. A biophysical simulation model of slow axonal transport
(A) A simulation model was developed as described in the text, consisting of a hypothetical axon cylinder, synapsin particles (green) distributed in the central zone and vectorial ‘mobile-units’ (white spheres). Scale bar is shown in the upper-left and elapsed time to the right of the frames. Screen-shots from a simulated time-lapse show mobile-units traversing through a pool of synapsin particles; one anterogradely moving particle is marked with small red arrows (also see Supplementary video #7). (B) Dynamics of association/dissociation and clustering of synapsin particles on a mobile unit shown in representative zoomed screen-shots from a simulated time-lapse. The red circle represents the ‘dissociation radii’ around a mobile unit that restricts the movements of the synapsin particles that collide with the mobile-units (see text). Note the stochastic clustering and dispersion of synapsin particles upon the mobile unit in successive frames; marked by yellow and magenta asterisks respectively.
Figure 7
Figure 7. Data-driven modeling of specific transport scenarios
Various parameters were introduced into the simulation-model to test specific scenarios that could not be readily addressed by experimentation, and the data-output was analyzed using kymographs and intensity-center analysis as described in the text. In all cases, synapsin particles were allowed to undergo Brownian motion and biophysical collisions. (A) Kymographs on the left show anterograde (red tracks) and/or retrograde (blue tracks) mobile-units traversing across a simulated axon containing synapsin particles. Middle kymographs show the dispersion of synapsin particles and the graphs on right show the corresponding intensity-center shifts. Note that these simulation parameters are not sufficient to generate a shift in the intensity center. (B) In these simulations, specific interactions were allowed between the synapsin particles and the mobile-units by creating a ‘dissociation radii’ around the mobile-units as detailed in the methods. Alteration of ‘dissociation radii’ led to changes in hypothetical interaction strengths, allowing us to test the effects of a range of interaction strengths in the simulation. Assumption of such interactions was necessary and sufficient to generate an anterograde shift of the synapsin population. However, when we assumed invariable dissociation radius/interaction strengths in the simulation, the intensity-center shifts were continuously linear and did not match the actual imaging data as shown in the top panels (also see Supplementary fig. 7). Instead, the imaging data was best-fitted by assuming a range of interactions as shown in the bottom panels. (C) Detailed data from the simulation above that best-fitted the actual imaging data. Note the anterograde shift of the synapsin population, qualitatively seen in the kymographs (left). In the simulated multiple-parameter overlaid kymograph (middle) synapsin particles are shown in green and tracks of anterograde and retrograde mobile-units are depicted in red and blue respectively. The yellow tracks represent instances of colocalization of anterograde mobile unit tracks (red) and synapsin particles (green). Note numerous instances of transient associations and vectorial motion evident in this kymograph. Graphs on the right show the various other outcomes of the simulation.

Comment in

Similar articles

Cited by

References

    1. Ahmari SE, Buchanan J, Smith SJ. Assembly of presynaptic active zones from cytoplasmic transport packets. Nat.Neurosci. 2000;3:445–451. - PubMed
    1. Baitinger C, Willard M. Axonal transport of synapsin I-like proteins in rabbit retinal ganglion cells. J.Neurosci. 1987;7:3723–3735. - PMC - PubMed
    1. Booj S, Larsson PA, Dahllof AG, Dahlstrom A. Axonal transport of synapsin I- and cholinergic synaptic vesicle-like material; further immunohistochemical evidence for transport of axonal cholinergic transmitter vesicles in motor neurons. Acta Physiol Scand. 1986;128:155–165. - PubMed
    1. Brangwynne CP, Koenderink GH, MacKintosh FC, Weitz DA. Cytoplasmic diffusion: molecular motors mix it up. J Cell Biol. 2008;183:583–587. - PMC - PubMed
    1. Brangwynne CP, Koenderink GH, MacKintosh FC, Weitz DA. Intracellular transport by active diffusion. Trends Cell Biol. 2009;19:423–427. - PubMed

Publication types

MeSH terms

Substances

LinkOut - more resources