. 2011 May 12;70(3):495-509.
doi: 10.1016/j.neuron.2011.03.023.

TRIP8b splice forms act in concert to regulate the localization and expression of HCN1 channels in CA1 pyramidal neurons

Affiliations

TRIP8b splice forms act in concert to regulate the localization and expression of HCN1 channels in CA1 pyramidal neurons

Rebecca Piskorowski et al. Neuron. .

Abstract

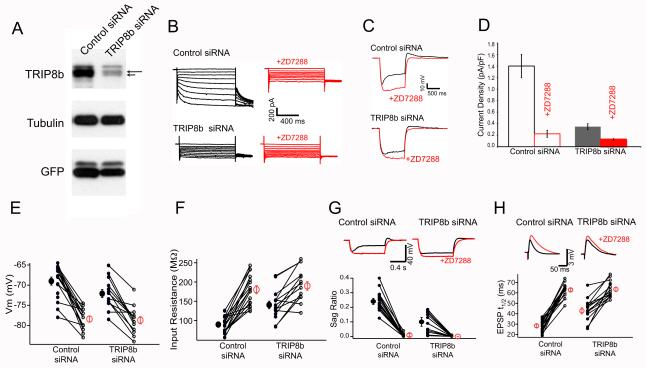
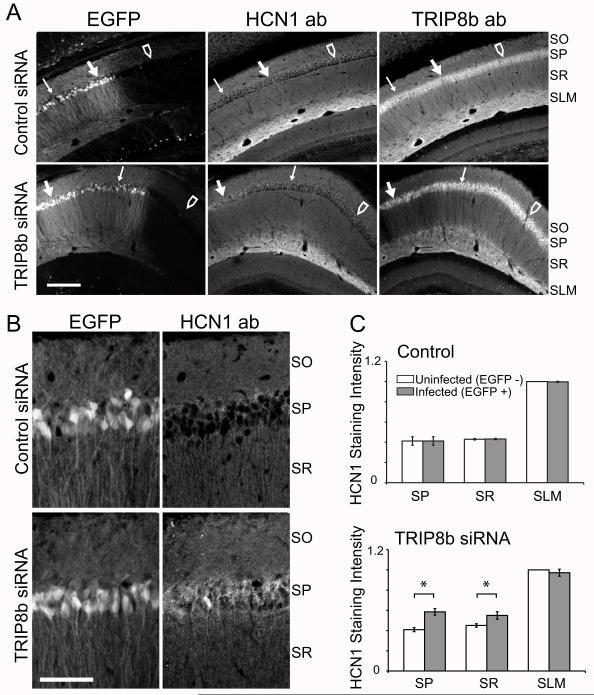
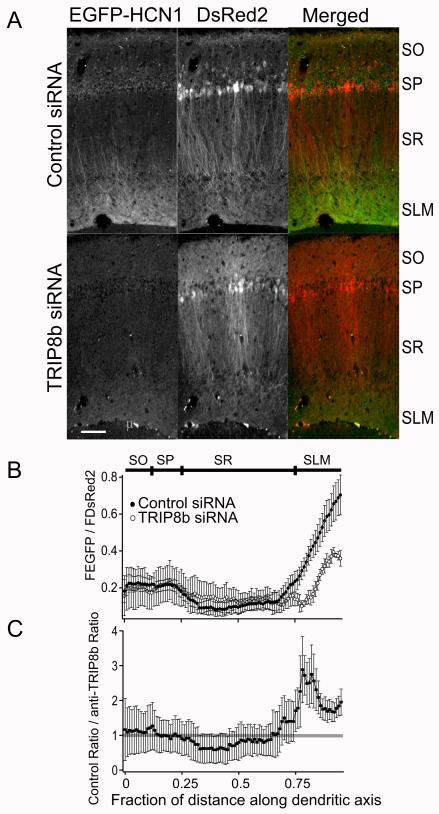
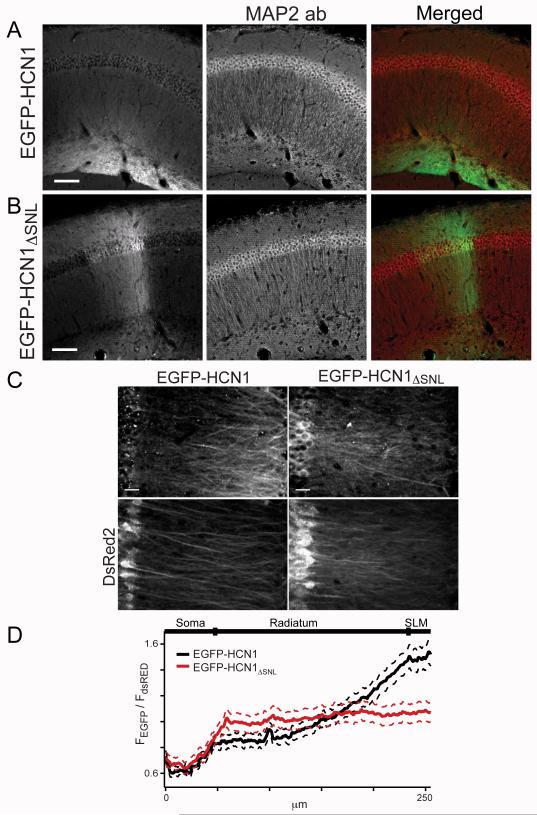
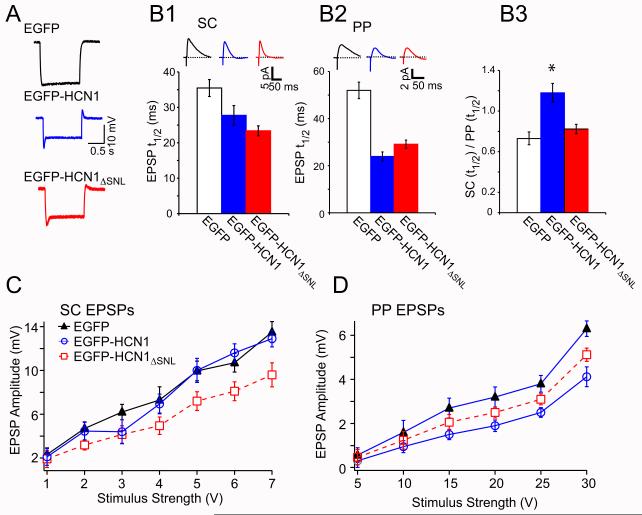
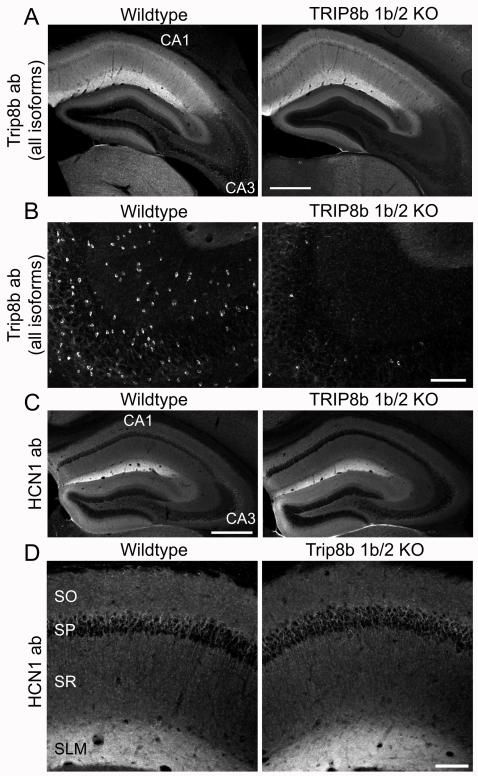
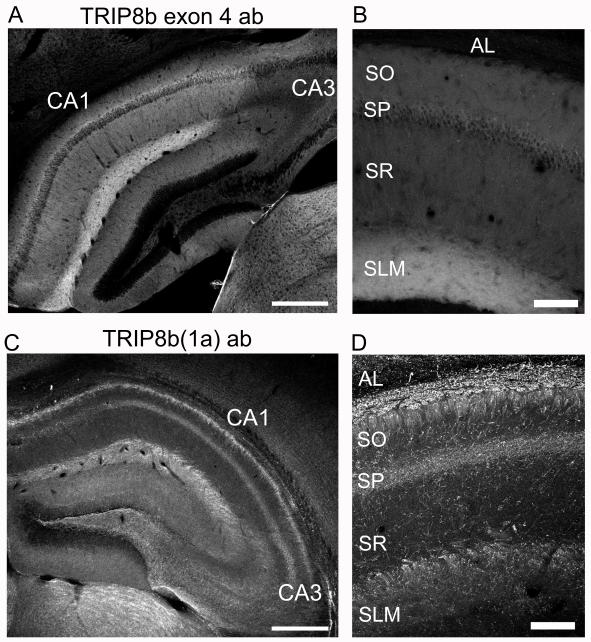
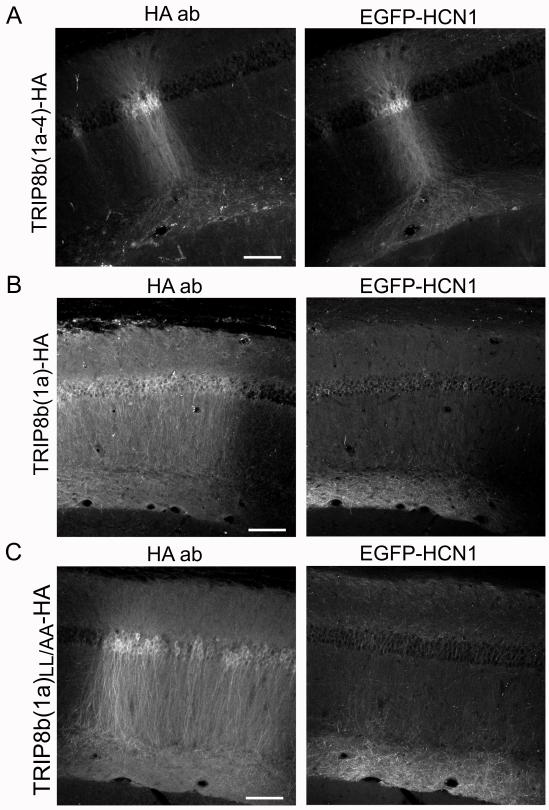
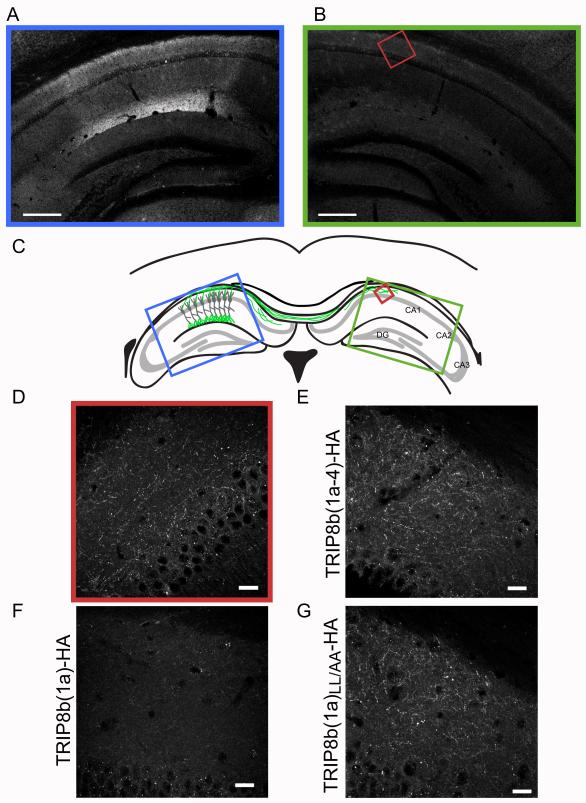
HCN1 channel subunits, which contribute to the hyperpolarization-activated cation current (Ih), are selectively targeted to distal apical dendrites of hippocampal CA1 pyramidal neurons. Here, we addressed the importance of the brain-specific auxiliary subunit of HCN1, TRIP8b, in regulating HCN1 expression and localization. More than ten N-terminal splice variants of TRIP8b exist in brain and exert distinct effects on HCN1 trafficking when overexpressed. We found that isoform-wide disruption of the TRIP8b/HCN1 interaction caused HCN1 to be mistargeted throughout CA1 somatodendritic compartments. In contrast, HCN1 was targeted normally to CA1 distal dendrites in a TRIP8b knockout mouse that selectively lacked exons 1b and 2. Of the two remaining hippocampal TRIP8b isoforms, TRIP8b(1a-4) promoted HCN1 surface expression in dendrites, whereas TRIP8b(1a) suppressed HCN1 misexpression in axons. Thus, proper subcellular localization of HCN1 depends on its differential additive and subtractive sculpting by two isoforms of a single auxiliary subunit.


Figures

Figure 1
Figure 1. Expression of TRIP8b siRNA alters the electrophysiological properties of CA1 neurons consistent with a reduction in Ih in vitro and in vivo
(A) Western blot of total protein extracts from hippocampal neuron cultures 18 days in vitro infected with lentiviral vectors expressing EGFP plus either control siRNA or TRIP8b siRNA. Note that TRIP8b siRNA reduced TRIP8b levels with no change in tubulin from cultures expressing roughly equal amounts of EGFP. The long arrow points to the TRIP8b(1a-4) band and the short arrow to TRIP8b(1a). (B) Voltage clamp recordings from dissociated hippocampal cultures show reduction in Ih with TRIP8b siRNA compared to control siRNA, before and after application of 10 μM ZD7288. Currents elicited by 3 s hyperpolarizing voltage steps from holding potential of −40 mV to −130 mV in 10 mV increments. (C) Current clamp recordings from dissociated hippocampal cultures show voltage responses to −80 pA hyperpolarizing and 0, +40 and +80 pA depolarizing current steps before and after application of 10 μM ZD7288. (D) Mean Ih current density from cells expressing control or TRIP8b siRNAs, before and after application of 10 μM ZD7288. Lower panels: electrophysiological properties of CA1 pyramidal neurons in acute slices expressing either control or TRIP8b siRNAs. Lines connect individual data points (small circles) from same slice in absence or presence of 10 μM ZD7288. Large circles: mean ± SEM. (E) Resting membrane potential. (F) Input resistance (measured with a 500 ms −50 pA hyperpolarizing current step). (G) Sag ratio (see Experimental Procedures). Traces show voltage responses to hyperpolarizing current pulses from a holding potential of −70 mV in absence (black traces) or presence (red traces) of 10 μM ZD7288 from cells expressing control (left) or TRIP8b (right) siRNA. (H) Somatic EPSP decay time (t1/2). Traces show somatic EPSPs in response to PP stimulus from cell expressing control (left) or TRIP8b (right) siRNAs, either in absence (black traces) or presence (red traces) of 10 μM ZD7288.
Figure 2
Figure 2. In vivo siRNA-mediated knockdown of TRIP8b reduces its protein levels and leads to redistribution of HCN1
(A) Expression pattern of EGFP, HCN1 or TRIP8b in CA1 region of hippocampal slices from brains of mice in which lentiviral vectors expressing control siRNA (top row) or TRIP8b knockdown siRNA (bottom row) were injected stereotactically in CA1. Left column, Images of EGFP fluorescence reveal variable pattern of viral expression, which ranged across transverse axis of a hippocampal slice from regions with very high siRNA expression (thick solid arrow), to regions with intermediate expression (thin arrow), to regions with undetectable viral infection (open arrow). Right column, Levels of TRIP8b detected by immunohistochemistry were decreased in region of slice where viral expression (EGFP signal) was highest (thick solid arrow). Levels of TRIP8b were unaffected in region of slice where viral expression was undetectable (open arrow). Middle column, Levels of HCN1 increased in somatic layer of CA1 where viral expression was very high (thick solid arrow). Scale bar 300 μm. (B) Higher-magnification z-series projections showing specific redistribution of HCN1 protein into the somatic layer of CA1 pyramidal cells infected with TRIP8b knockdown siRNA. Note lack of somatic staining with control siRNA. Scale bar 10 μm. (C) Quantification of HCN1 staining in the SP, SR and SLM regions of CA1 infected with control (top) or anti-TRIP8b (bottom) siRNAs. EGFP-positive regions were compared to EGFP- negative regions in same slice. HCN1 fluorescence intensity was normalized by setting the maximal intensity of the image to 1. Note significant increase in relative staining in soma and SR (*, P<0.05; t-test).
Figure 3
Figure 3. TRIP8b siRNA impairs the dendritic expression of EGFP-HCN1 in HCN1 KO mice
(A) EGFP-HCN1 was co-expressed with either control (top row) or anti-TRIP8b (bottom row) siRNAs using independent lentiviral vectors in HCN1 KO mice. Left column: Fluorescence signal from EGFP-HCN1. Middle column: DsRed2 signal (expressed from siRNA vector). Right column: merged signal showing EGFP-HCN1 (green) and DsRed2 (red). Note effect of TRIP8b siRNA to reduce EGFP-HCN1 signal, especially in distal dendrites. Scale bar, 100 μm. (B) Ratio of EGFP-HCN1 to DsRed2 fluorescence as function of distance along somatodendritic axis in slices infected with control (filled symbols) or TRIP8b (open symbols) siRNAs. Symbols show mean; error bars show SEM. (C) EGFP-HCN1/DsRed2 ratio from slices infected with control siRNA divided by ratio from slices infected with TRIP8b siRNA. Note selective decrease in HCN1 staining in distal dendrites of SR and SLM. (Error bars, SEM). The horizontal grey line indicates a ratio of 1.
Figure 4
Figure 4. HCN1ΔSNL truncation mutant shows defective trafficking to CA1 distal dendrites
Images of CA1 region from hippocampal slices from HCN1 KO mouse expressing EGFP-HCN1 (A) or EGFP-HCN1ΔSNL (B). EGFP-tagged channel fluorescence (left column) and as green (right column). Staining for MAP2 dendritic marker (middle column) and as red (right). Note that full-length EGFP-HCN1 was trafficked efficiently to distal apical dendrites whereas EGFP-HCN1ΔSNL showed even dendritic distribution, with relatively high expression in soma and proximal apical and basal dendrites. Scale bar is 200 μm. (C) Higher magnification z-series projections showing fluorescence signals for EGFP-HCN1, EGFP-HCN1ΔSNL, and co-expressed DsRed2. Scale bar is 10 μm. (D) EGFP and DsRed2 fluorescence intensities were measured along somato-dendritic axis in soma and apical dendrites of individual cells. Mean EGFP signal averaged from individual dendrites was normalized by DsRed2 signal and plotted as function of distance from somatic layer for neurons expressing EGFP-HCN1 (black) or EGFP-HCN1ΔSNL (red). (Solid lines: means; dashed lines: SEM).
Figure 5
Figure 5. Whole-cell recordings from CA1 neurons expressing EGFP-HCN1 or EGFP-HCN1ΔSNL indicate presence of Ih in intracellular compartments
A series of electrophysiological properties were determined for CA1 pyramidal neurons from HCN1 KO mice expressing EGFP (control, black), EGFP-HCN1 (blue) or EGFP-HCN1ΔSNL (red). (A) Somatic voltage traces from whole-cell current-clamp recordings showing expression of full-length or truncated HCN1 resulted in a prominent depolarizing voltage sag in response to 100 pA hyperpolarizing current steps from a holding potential of −70 mV. (B) Expression of EGFP-HCN1 and EGFP-HCN1ΔSNL differentially enhanced t1/2 decay time of EPSPs in response to stimulation of proximal (SC) inputs (B1) versus distal (PP) inputs (B2). (B3) Ratio of SC/PP EPSP t1/2 values was significantly different following expression of EGFP-HCN1 versus EGFP-HCN1ΔSNL. Peak amplitude input-output curves for SC (C) and PP (D) EPSPs from CA1 pyramidal neurons expressing EGFP (black triangles), EGFP-HCN1 (blue circles) or EGFP-HCN1ΔSNL (red squares). (Error bars: SEM).
Figure 6
Figure 6. Expression of TRIP8b and HCN1 in hippocampal slices from TRIP8b exon 1b/2 knockout mice
(A) Coronal hippocampal sections from wild-type and TRIP8b exon 1b/2 knockout mice littermates. Slices were labeled with a monoclonal pan-TRIP8b antibody that binds to all isoforms. Scale bar 500 μm. (B) Higher magnification z-axis projection of area CA3 from wildtype and TRIP8b 1b/2 KO mice, showing loss of pan-TRIP8b staining from small glial-like cells following deletion of exons 1b and 2. Scale bar 100 μm. (C) Immunolabelling of slices from wild-type and TRIP8b 1b/2 KO littermates mice showing a normal expression pattern of endogenous HCN1 throughout the hippocampus. Scale bar 500 μm. (D) Higher magnification z-axis projection of area CA1 showing the identical targeting of HCN1 to distal dendrites in SLM of wildtype and TRIP8b 1b/2 KO mice. Scale bar, 100 μm.
Figure 7
Figure 7. The endogenous expression patterns of TRIP8b isoforms containing exon 4 and TRIP8b(1a) show complementary localization
(A) Coronal brain sections immunolabelled with an antibody specific to exon 4 of TRIP8b. Strongest signal was seen in distal dendrites of CA1 in SLM, scale bar 500 μm. (B) Higher-magnification z-projection image of CA1, scale bar 100 μm. (C) Immunolabeling with an antibody recognizing TRIP8b(1a). Note the high expression in the alveus of the hippocampus, scale bar 500 μm. (D) Higher magnification images reveal that TRIP8b(1a) is localized to fiber bundles in SO, SLM and in sparse fibers in SR. Scale bar, 100 μm.
Figure 8
Figure 8. Overexpression of TRIP8b(1a-4), but not TRIP8b(1a), alters the dendritic expression pattern of EGFP-HCN1
(A) CA1 region of hippocampus of HCN1 knockout mouse infected with independent viruses expressing HA-tagged TRIP8b(1a-4) and EGFP-HCN1. Left column. Immunofluorescence from anti-HA antibody, reflecting location of expressed TRIP8b(1a-4). Right column, EGFP-HCN1 fluorescence. Note how EGFP-HCN1 expression pattern mirrored that of TRIP8b(1a-4)-HA. (B) Localization of virally expressed HA-tagged TRIP8b(1a) and coexpressed EGFP-HCN1. (C) Localization of mutant TRIP8b(1a)LL/AA-HA and coexpressed EGFP-HCN1. Scale bars, 100 μm.
Figure 9
Figure 9. TRIP8b(1a) downregulates expression of EGFP-HCN1 in axons
(A) Low magnification image of EGFP-HCN1 fluorescence from hippocampus of HCN1 KO mouse infected with independent TRIP8b(1a)-HA and EGFP-HCN1 viral vectors. (B) Fluorescence image from uninjected contralateral hippocampus from same mouse. Scale bars, 500 μm. (C) Diagram illustrating the distal dendritic expression pattern of infected neurons at injection site and the location of axonal fibers in the contralateral hippocampus. The blue, green and red boxes correspond to the regions shown in A, B and D. (D) Higher-magnification image of EGFP-HCN1 labeled axonal fibers in the contralateral hippocampus. Scale bar, 20 μm. (E, F and G) Similar experiment as in A-D, except EGFP-HCN1 is coexpressed with TRIP8b(1a-4)-HA (E), TRIP8b(1a)-HA (F), or TRIP8b(1a)LL/AA (G). Note how TRIP8b(1a)-HA selectively downregulates EGFP-HCN1 in axons. Scale bar 20 μm.

References

    1. Arnold DB. Actin and microtubule-based cytoskeletal cues direct polarized targeting of proteins in neurons. Sci Signal. 2009;2:pe49. - PMC - PubMed
    1. Bonifacino JS, Traub LM. Signals for sorting of transmembrane proteins to endosomes and lysosomes. Annu Rev Biochem. 2003;72:395–447. - PubMed
    1. Brager DH, Johnston D. Plasticity of intrinsic excitability during long-term depression is mediated through mGluR-dependent changes in I(h) in hippocampal CA1 pyramidal neurons. J Neurosci. 2007;27:13926–13937. - PMC - PubMed
    1. Brewster A, Bender RA, Chen Y, Dube C, Eghbal-Ahmadi M, Baram TZ. Developmental febrile seizures modulate hippocampal gene expression of hyperpolarization-activated channels in an isoform- and cell-specific manner. J Neurosci. 2002;22:4591–4599. - PMC - PubMed
    1. Brewster AL, Bernard JA, Gall CM, Baram TZ. Formation of heteromeric hyperpolarization-activated cyclic nucleotide-gated (HCN) channels in the hippocampus is regulated by developmental seizures. Neurobiol Dis. 2005;19:200–207. - PMC - PubMed

Publication types

MeSH terms