. 2011 May 12;70(3):560-72.
doi: 10.1016/j.neuron.2011.02.056.

Triangulating the neural, psychological, and economic bases of guilt aversion

Affiliations

Triangulating the neural, psychological, and economic bases of guilt aversion

Luke J Chang et al. Neuron. .

Abstract

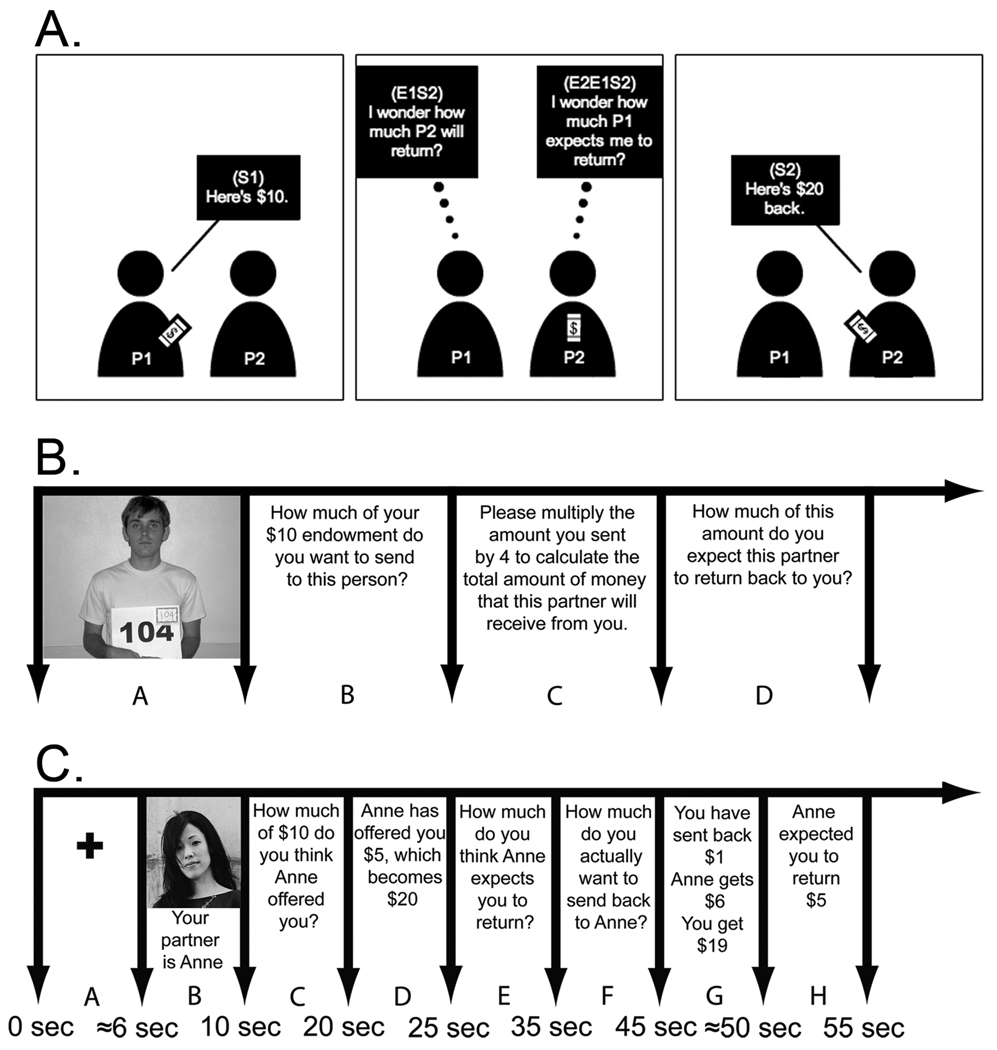
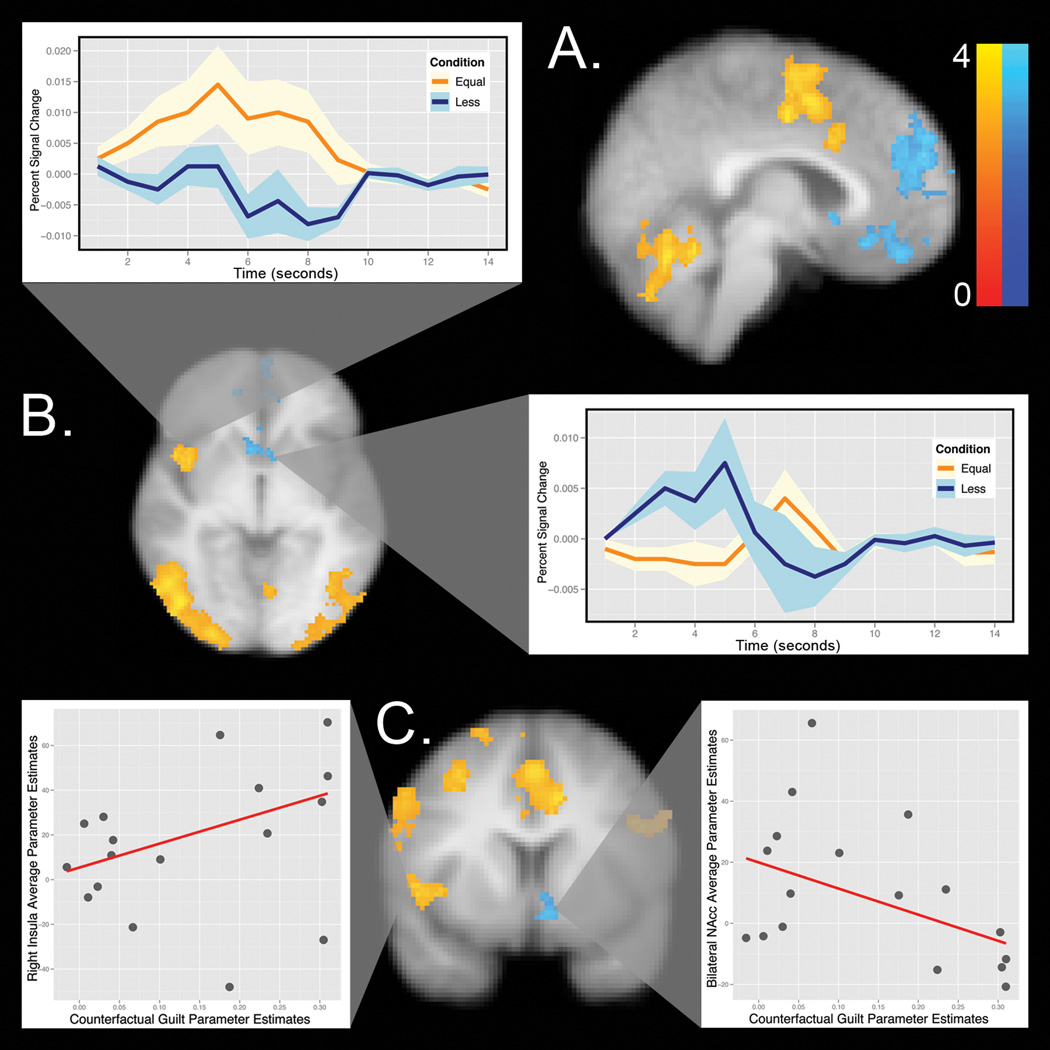
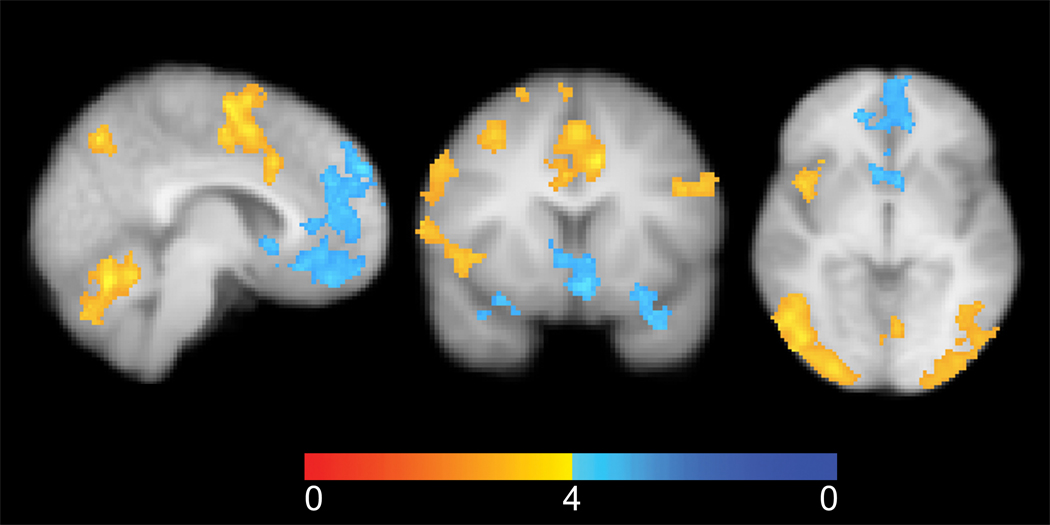
Why do people often choose to cooperate when they can better serve their interests by acting selfishly? One potential mechanism is that the anticipation of guilt can motivate cooperative behavior. We utilize a formal model of this process in conjunction with fMRI to identify brain regions that mediate cooperative behavior while participants decided whether or not to honor a partner's trust. We observed increased activation in the insula, supplementary motor area, dorsolateral prefrontal cortex (PFC), and temporal parietal junction when participants were behaving consistent with our model, and found increased activity in the ventromedial PFC, dorsomedial PFC, and nucleus accumbens when they chose to abuse trust and maximize their financial reward. This study demonstrates that a neural system previously implicated in expectation processing plays a critical role in assessing moral sentiments that in turn can sustain human cooperation in the face of temptation.


Figures

Figure 1
Figure 1. Trial Timeline
A) Schematic of Trust Game (TG) with beliefs. Player 1 decides how much of their endowment they want to invest in Player 2 (S1) and has an expectation about the amount of money that Player 2 will return (E1S2). The amount that Player 1 invests is multiplied by a factor of 4 by the experimenter. Player 2 has a belief about Player 1’s expectation (E2E1S2) and decides how much money to return back Player 1 (S2). B) At session 1, all participants met as a group and played in the role of the Investor. After making an investment to every player, they were also asked how much of this amount (multiplied by 4) they believed their partner would return to them. C) Session 2 took place while the participants underwent functional magnetic resonance imaging and played in the role of Trustee. Participants first saw a fixation cross (A) and then a picture of their partner (B) on that round. Participants’ beliefs about their partner’s offer were then recorded (C) and then the actual offer was revealed (D). Next, participants’ beliefs about the amount of money they believed their partner expected them to reciprocate were recorded (E) and they then decided how much they actually wanted to return (F). The final outcome was displayed (G) and then the partner’s actual expectations were revealed (H).
Figure 2
Figure 2. Behavioral results
Panel A depicts a histogram of the Investor’s Investment for all trials for all participants (mean=51.7%, sd=20.7%). Panel B depicts a histogram of the percentage of their investment (multiplied by 4) that they expect the Trustee to return (1st Order Belief) (mean=40.81%, sd=10.44%). Panel C depicts a histogram of the percentage of the Investor’s investment (multiplied by 4) that the Trustee believes the Investor expects them to return (2nd Order Belief) (mean=44.33%, sd=3.52%). Panel D depicts the percentage of the Investor’s investment (multiplied by 4) that the Trustee decides to return (mean=38.37%, sd=7.80%).
Figure 3
Figure 3. Behavioral results
A) Investor’s 1st order belief (E1S2) by the Trustee’s 2nd order belief (E2E1S2). B) The amount returned by the Trustee (S2) by their 2nd order belief (see Table S1 for additional analyses). C) Participant’s self-reported counterfactual guilt (the amount of guilt they would have felt had they returned less money) by the difference from their hypothetical choice from their actual behavior. The dotted lines represent participant’s best linear unbiased predictors (BLUPs).
Figure 4
Figure 4. Minimizing Guilt Compared to Maximizing Financial Reward
A) Increased activity (yellow) in the SMA, ACC, and cerebellum when matching expectations. Increased activity (blue) in the NAcc, VMPFC, and DMPFC can be seen when participants returned less than their second order belief. The color map indicates Z values between 0 and 4. B) Increased activity (yellow) in the insula when matching expectations and increased activity (blue) in the bilateral NAcc when returning less than their expectations. C) Increased activity in the insula, SMA, and right DLPFC (yellow) when matching expectations and increased activity (blue) in the left NAcc when returning less than expectations. The left blowup depicts the relationship between participant’s counterfactual guilt sensitivity and their average activity for the insula. The right blowup depicts participant’s estimated counterfactual guilt sensitivity and their average activity in the bilateral NAcc. See Figure S1 for a blowup of the SMA. Images are presented using radiological conventions (right=left) on the participant’s average high resolution T1 image. The images are whole-brain thresholded using cluster correction Z>2.3, p<0.05.
Figure 5
Figure 5. Parametric contrast between matching expectations and returning less than second order beliefs
This figure reflects the parametric contrast (+6 −1 −2 −3) of the regressors indicating matching expectations, returning 10% less than expectations, returning 20% less than expectations, and returning +30% less than expectations. Images are displayed in radiological orientation (left=right) and are thresholded using whole brain cluster correction, Z>2.3, p<0.05. Color maps reflect Z values between 0 and 4.

Similar articles

Cited by

References

    1. Amodio DM, Frith CD. Meeting of minds: the medial frontal cortex and social cognition. Nat Rev Neurosci. 2006;7:268–277. - PubMed
    1. Andreoni J. Impre altruism and donations to public goods: a theory of warm-glow giving. The Economic Journal. 1990;100:464–477.
    1. Baayen RH, Davidson DJ, Bates DM. Mixed-effects modeling with crossed random effects for subjects and items. Journal of Memory and Language. 2008;59:340–412.
    1. Bates D, Maechler M, Dai B. lme4: Linear mixed-effects models using s4 classes. 2008
    1. Battigalli P, Dufwenberg M. Guilt in games. American Economic Review. 2007;97:170–176.

Publication types

LinkOut - more resources