. 2011 May 16;193(4):643-53.
doi: 10.1083/jcb.201008135. Epub 2011 May 9.

Dual-mode of insulin action controls GLUT4 vesicle exocytosis

Affiliations

Dual-mode of insulin action controls GLUT4 vesicle exocytosis

Yingke Xu et al. J Cell Biol. .

Abstract

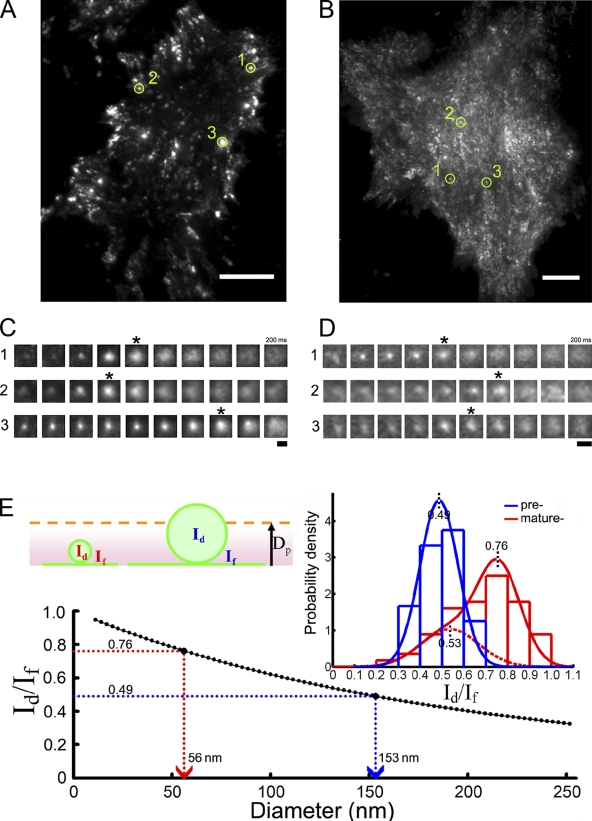
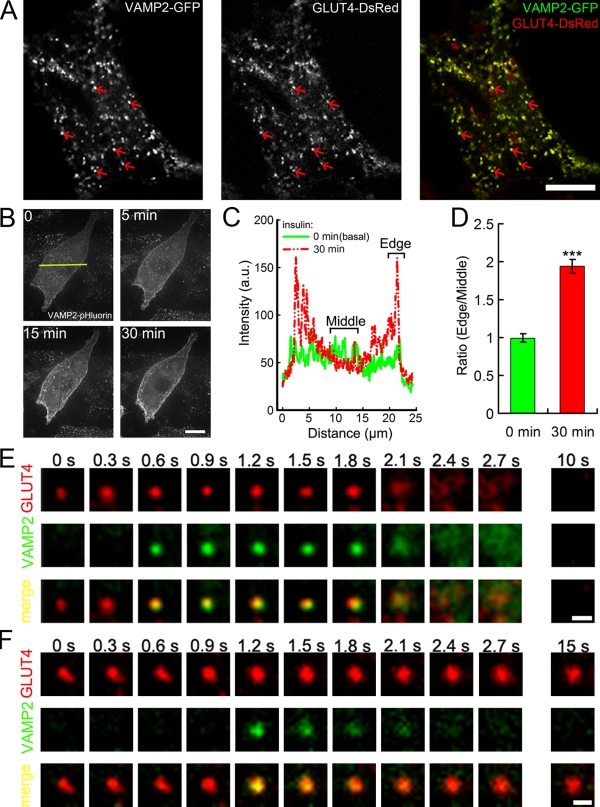
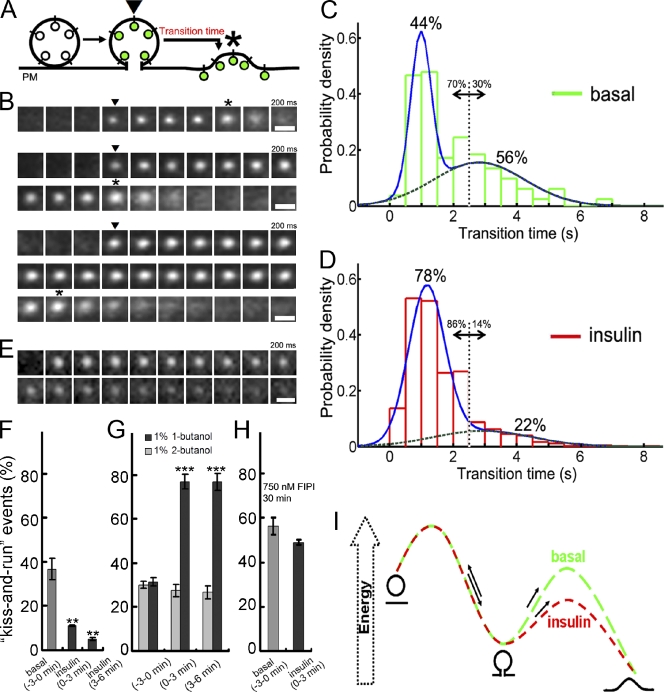
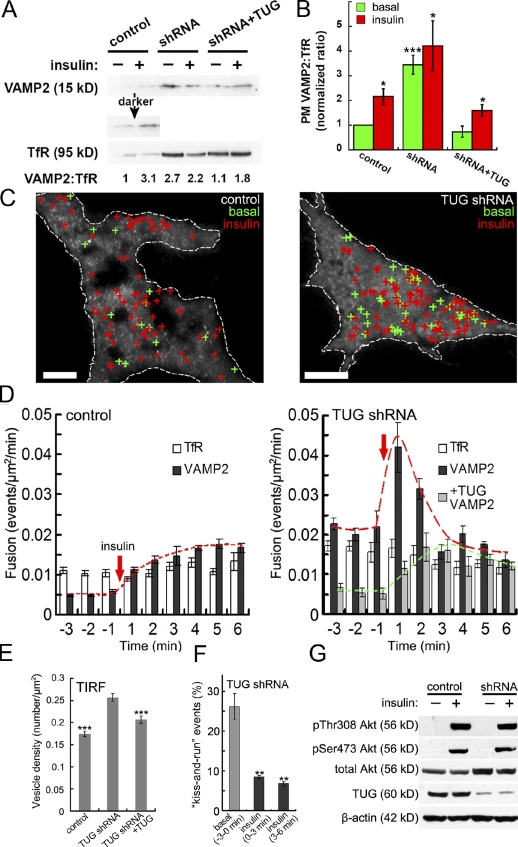
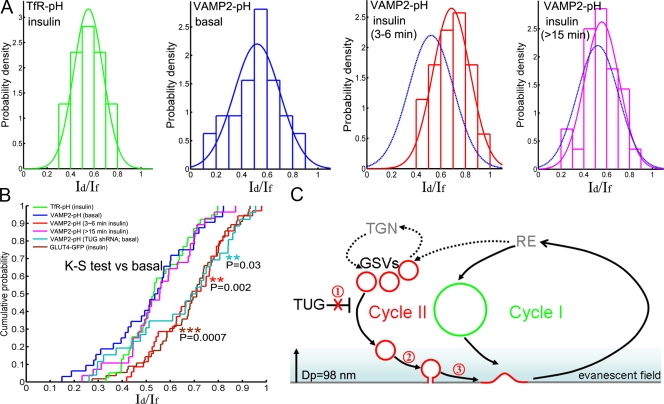
Insulin stimulates translocation of GLUT4 storage vesicles (GSVs) to the surface of adipocytes, but precisely where insulin acts is controversial. Here we quantify the size, dynamics, and frequency of single vesicle exocytosis in 3T3-L1 adipocytes. We use a new GSV reporter, VAMP2-pHluorin, and bypass insulin signaling by disrupting the GLUT4-retention protein TUG. Remarkably, in unstimulated TUG-depleted cells, the exocytic rate is similar to that in insulin-stimulated control cells. In TUG-depleted cells, insulin triggers a transient, twofold burst of exocytosis. Surprisingly, insulin promotes fusion pore expansion, blocked by acute perturbation of phospholipase D, which reflects both properties intrinsic to the mobilized vesicles and a novel regulatory site at the fusion pore itself. Prolonged stimulation causes cargo to switch from approximately 60 nm GSVs to larger exocytic vesicles characteristic of endosomes. Our results support a model whereby insulin promotes exocytic flux primarily by releasing an intracellular brake, but also by accelerating plasma membrane fusion and switching vesicle traffic between two distinct circuits.


Figures

Figure 1.
Figure 1.
3T3-L1 adipocyte differentiation induces a change in the size of GLUT4 vesicles. (A–D) Single vesicle fusion events were visualized by TIRFM imaging of 3T3-L1 cells stably expressing GLUT4-GFP (see Videos 1 and 2). Maximum projection time-lapse (10 Hz) images of preadipocytes (A) and mature adipocytes (B) are shown, with galleries of single fusion events (asterisks) underneath (C and D). (E) Theoretical ratio of the fluorescence intensities of docked (Id) to fully fused (If) membrane-labeled vesicles in an evanescent field of measured penetration depth, Dp (98 nm), were modeled as a function of vesicle size (black curve, see Materials and methods). Id/If were measured for GLUT4 vesicles from preadipocytes and mature adipocytes and fitted to Gaussian distributions (inset), and the mean vesicle diameters were calculated using the black look-up curve (arrows). Bars: (A and B) 10 µm; (C and D) 1 µm.
Figure 2.
Figure 2.
Validation of VAMP2-pHluorin as a new probe to visualize GSVs. 3T3-L1 adipocytes were electroporated with VAMP2 and/or GLUT4 and imaged by SDCM and TIRFM. (A) VAMP2-GFP and GLUT4-DsRed colocalize extensively (arrows). (B–D) Insulin-stimulated VAMP2-pHluorin translocation. 3T3-L1 adipocytes electroporated with VAMP2-pHluorin were imaged by 3D time-lapse SDCM. (B) Maximum z-projection images were taken before (0 min) and after (5–30 min) 100 nM insulin addition. (C) Fluorescence intensity line profiles (yellow line in B) were plotted for images before (green) and 30 min after (red) insulin. (D) The ratio of edge-to-middle intensities from line profiles of 10 cells was plotted (error bars indicate mean ± SEM; ***, p < 0.001). (E and F) VAMP2-pHluorin colocalizes with GLUT4-DsRed and allows detection of full fusion (E) and kiss-and-run (F) fusion events using dual-color TIRFM. Bars: (A and B) 10 µm; (E and F) 1 µm.
Figure 3.
Figure 3.
Insulin regulates the stability of the vesicle fusion pore. (A) pHluorin’s fluorescence brightens (arrowhead) upon fusion pore formation, and then spreads laterally as the vesicle collapses into the PM (asterisk; see Fig. S1 [C and D] for fusion criteria). (B) Three examples of VAMP2-pHluorin fusion events with different durations of pore opening. (C and D) Vesicle “transition times” (arrowhead to asterisk) were measured in basal (C, n = 163) and insulin-stimulated (D, n = 894) cells, plotted as histograms, and fitted with a dual Gaussian distribution. (E) A representative kiss-and-run fusion event, whereby the signal slowly dimmed but did not spread (see Fig. S1 D). Bars, 1 µm. (F–H) Percentage of kiss-and-run events in basal and insulin-stimulated cells (F, n = 734 from three cells; **, P < 0.01), after addition of 1-butanol (G, n = 759 from three cells) or 2-butanol (n = 733 from three cells; ***, P < 0.001), and in FIPI-treated cells, before and after insulin (H, n = 150 from two cells). Error bars indicate mean ± SEM. (I) Working model of the energy landscape of vesicle fusion. Insulin reduces the barrier to full fusion after formation of the fusion pore.
Figure 4.
Figure 4.
TUG disruption increases GSV exocytic flux in unstimulated 3T3-L1 adipocytes. (A) Immunoblots of PM fractions from control, TUG shRNA, and rescued (shRNA+TUG) cells. The ratio of VAMP2 to TfR abundance is indicated for each sample, normalized to unstimulated control cells. (B) PM VAMP2:TfR was measured in three experiments by fractionation and immunoblotting. Mean ± SEM is plotted (error bars). *, P < 0.05; and ***, P < 0.001 relative to basal control. (C) VAMP2-pHluorin was expressed transiently in control and TUG shRNA cells, and fusion events (crosses) were marked over a 3-min window before (green) and after (red) insulin stimulation (see Videos 3 and 4). Bars, 10 µm. (D) Frequencies of VAMP2-pHluorin and TfR-pHluorin fusion events in control (n = 1,070 from five cells) and TUG shRNA 3T3-L1 adipocytes (n = 895 from five cells). VAMP2-pHluorin events are also plotted for “rescued” TUG shRNA+TUG cells (containing shRNA-resistant TUG, n = 262 from three cells). Data are mean ± SEM (error bars). (E) GLUT4-GFP was transfected in control, TUG shRNA, and rescued (TUG shRNA+TUG) cells and imaged by TIRFM. Density of single vesicles in the evanescent field of unstimulated cells (n = 20 shRNA, 12 control, and 12 rescued cells; Dp = 98 nm; n = 10; ***, P < 0.001). (F) Percentage of kiss-and-run events in TUG shRNA cells (n = 676 from three cells; **, P < 0.01). Error bars indicate mean ± SEM. (G) Immunoblots were performed as indicated on control and TUG shRNA adipocytes.
Figure 5.
Figure 5.
Insulin regulates two distinct pools of GLUT4-containing vesicles. 3T3-L1 adipocytes were transfected with plasmids encoding TfR-pHluorin or VAMP2-pHluorin, and imaged by TIRFM before and after 100 nM insulin stimulation. (A) Ratios of the fluorescence intensities of fusion pore open and fully fused states, Id/If, were measured using the indicated reporters. Histograms were plotted and fitted with Gaussian distributions, with basal VAMP2-pHluorin is shown as a reference (blue). TfR-pHluorin data were similar for basal and insulin-stimulated cells; insulin data are shown. (B) Cumulative probability plots of data. Significance was assessed using a Kolmogorov-Smirnov test with basal VAMP2-pHluorin data as a reference set. (C) Dual brake–accelerator model of GSV translocation. Insulin acts both to release an intracellular brake (1) and to accelerate docking (2) and full fusion (3) at the PM, and switches vesicle traffic between two cycles (see text).

Similar articles

Cited by

References

    1. Bai L., Wang Y., Fan J., Chen Y., Ji W., Qu A., Xu P., James D.E., Xu T. 2007. Dissecting multiple steps of GLUT4 trafficking and identifying the sites of insulin action. Cell Metab. 5:47–57 10.1016/j.cmet.2006.11.013 - DOI - PubMed
    1. Barg S., Olofsson C.S., Schriever-Abeln J., Wendt A., Gebre-Medhin S., Renström E., Rorsman P. 2002. Delay between fusion pore opening and peptide release from large dense-core vesicles in neuroendocrine cells. Neuron. 33:287–299 10.1016/S0896-6273(02)00563-9 - DOI - PubMed
    1. Bogan J.S., Kandror K.V. 2010. Biogenesis and regulation of insulin-responsive vesicles containing GLUT4. Curr. Opin. Cell Biol. 22:506–512 10.1016/j.ceb.2010.03.012 - DOI - PMC - PubMed
    1. Bogan J.S., McKee A.E., Lodish H.F. 2001. Insulin-responsive compartments containing GLUT4 in 3T3-L1 and CHO cells: regulation by amino acid concentrations. Mol. Cell. Biol. 21:4785–4806 10.1128/MCB.21.14.4785-4806.2001 - DOI - PMC - PubMed
    1. Bogan J.S., Hendon N., McKee A.E., Tsao T.S., Lodish H.F. 2003. Functional cloning of TUG as a regulator of GLUT4 glucose transporter trafficking. Nature. 425:727–733 10.1038/nature01989 - DOI - PubMed

Publication types

MeSH terms