. 2011 Jun 6;208(6):1189-201.
doi: 10.1084/jem.20101823. Epub 2011 May 9.

miR-146a is a significant brake on autoimmunity, myeloproliferation, and cancer in mice

Affiliations

miR-146a is a significant brake on autoimmunity, myeloproliferation, and cancer in mice

Mark P Boldin et al. J Exp Med. .

Abstract

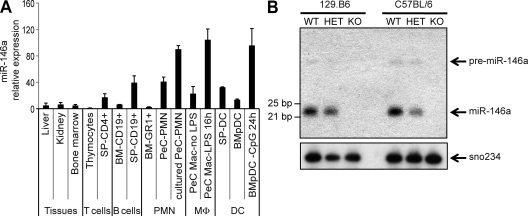
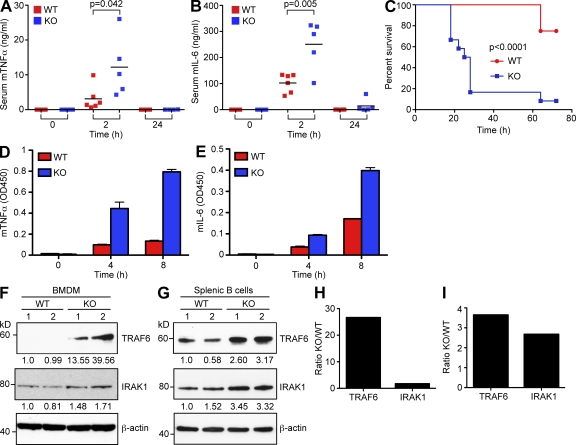
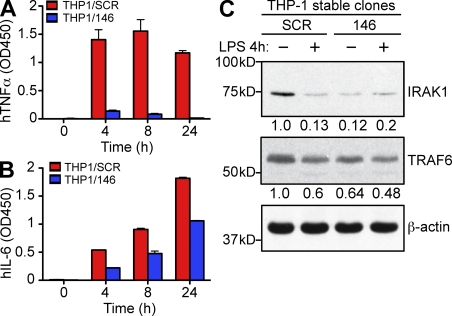
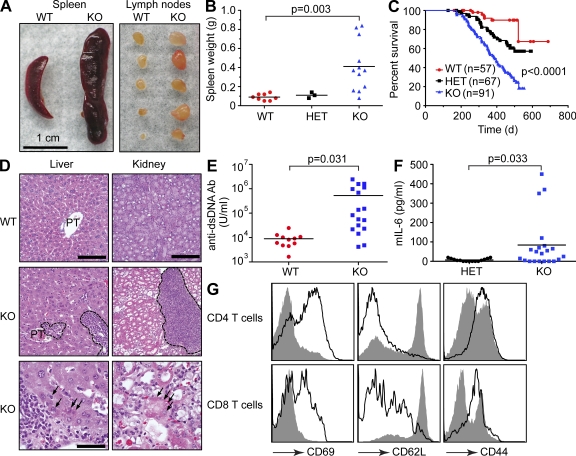
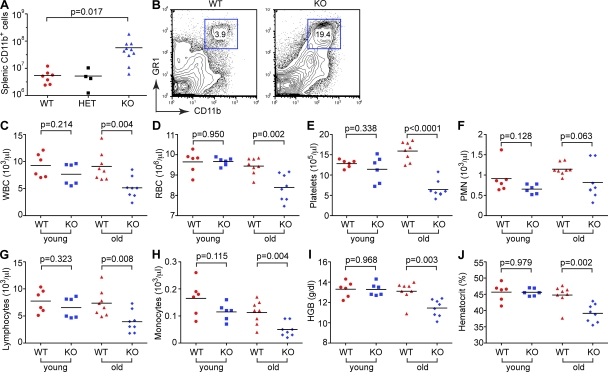
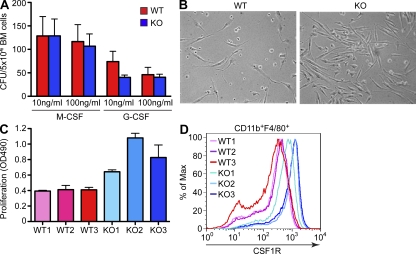
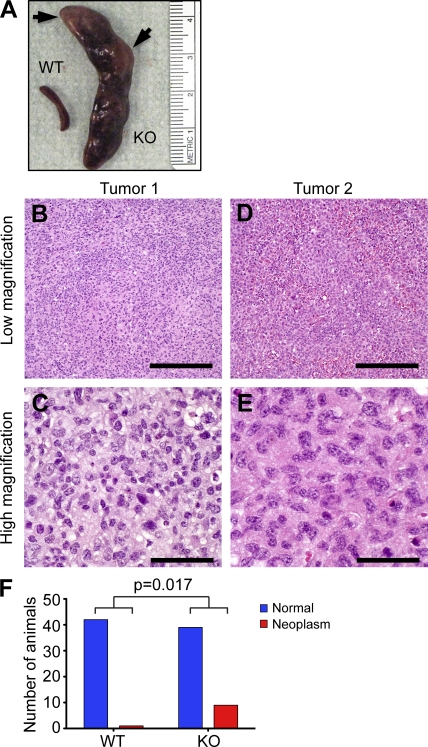
Excessive or inappropriate activation of the immune system can be deleterious to the organism, warranting multiple molecular mechanisms to control and properly terminate immune responses. MicroRNAs (miRNAs), ∼22-nt-long noncoding RNAs, have recently emerged as key posttranscriptional regulators, controlling diverse biological processes, including responses to non-self. In this study, we examine the biological role of miR-146a using genetically engineered mice and show that targeted deletion of this gene, whose expression is strongly up-regulated after immune cell maturation and/or activation, results in several immune defects. Collectively, our findings suggest that miR-146a plays a key role as a molecular brake on inflammation, myeloid cell proliferation, and oncogenic transformation.


Figures

Figure 1.
Figure 1.
Profile of miR-146a gene expression in normal mouse tissues and abrogation of its expression in miR-146a−/− mice. (A) qRT-PCR analysis of mature miR-146a expression in various mouse tissues (BALB/c strain) and purified hematopoietic cells. Data are the mean of three mouse samples, and miR-146a expression from different tissues was normalized by U6 snRNA level. PMN, polymorphonuclear leukocyte; MΦ, macrophages; BM-Gr1+, purified Gr1+ cells from BM; BM-CD19+, purified CD19+ BM cells; SP-CD4+, purified CD4+ splenocytes; SP-CD19+, purified CD19+ splenocytes; PeC PMN, thioglycollate-elicited neutrophils lysed immediately after isolation or after being cultured in vitro for 3 h; PeC Mac, thioglycollate-elicited macrophages cultured in vitro for 16 h with or without 20 ng/ml LPS; SP DC, CD11c+MHCII+ splenic dendritic cells; BMpDC, BM-derived Flt3L-differentiated B220+Ly6C+PDCA1+CD11b plasmacytoid dendritic cells; BMpDC 24 h CpG, BMpDCs stimulated with 5 µg/ml CpG for 24 h. Expression level of miR-146a in thymocytes was set arbitrarily to 1. Data are represented as mean ± SD. (B) Northern Blot analysis of miR-146a expression in splenocytes isolated from WT, miR-146a+/− (HET), and miR-146a−/− (KO) mice on two different genetic backgrounds, as indicated. Membrane was probed with DNA oligonucleotide complementary to mature miR-146a and then reprobed with sno234 probe to control for loading (bottom).
Figure 2.
Figure 2.
Exaggerated inflammatory response in miR-146a–null mice. (A and B) Serum levels of TNF (A) and IL-6 (B) in miR-146a−/− (n = 5; KO) and WT (n = 6) animals challenged intraperitoneally with sublethal dose of LPS (1 mg/kg). Peripheral blood was drawn at the times indicated in the graphs, and cytokine concentrations were assessed by ELISA. Results are shown as means; data are representative of two independent experiments. P-value calculations were performed using Student’s t test. (C) Kaplan-Meier survival curves of miR-146a−/− (KO) and WT mice (n = 12 for each group) challenged with a lethal dose of LPS (35 mg/kg). Results are representative of two independent experiments. P-value calculation was performed using log-rank (Mantel-Cox) test. (D and E) Production of TNF (D) and IL-6 (E) by miR-146a−/− (KO) and WT BMDMs in response to 10 ng/ml LPS challenge. Cells were stimulated for the indicated time, and cytokine concentrations were assessed by ELISA. Data are shown as mean ± SD. Results are representative of three independent experiments. (F and G) Western blot analysis of TRAF6 and IRAK1 protein expression in WT and miR-146a−/− (KO) BMDMs (F) and CD19+ splenic B cells (G). Numbers under the blots denote relative expression normalized to β-actin expression for each sample. Two mice per genotype were analyzed. Results are representative of two independent experiments. (H and I) Quantification of Western blots in F and G. Relative TRAF6 and IRAK1 expression in WT and KO BMDMs (H) and CD19+ splenic B cells (I) is plotted. Data from two mice for each genotype were averaged and are expressed as a ratio of protein expression in miR-146a KO to WT cells. All experiments were carried in the B6/miR-146a−/− strain of mice.
Figure 3.
Figure 3.
Ectopic expression of miR-146a in THP-1 cells results in attenuation of inflammatory response. (A and B) Production of TNF (A) and IL-6 (B) by THP-1 stable cell lines ectopically expressing either miR-146a (THP1/146) or scramble control sequence (THP1/SCR) in response to 1 µg/ml LPS stimulation. Cells were stimulated for the indicated time, and cytokines concentrations were assessed by ELISA. Results are shown as mean ± SD. Data are representative of two independent experiments. (C) Western blot analysis of TRAF6 and IRAK1 protein expression in THP1/146 and THP1/SCR clones stimulated or not with LPS, as indicated. Numbers under the blots denote relative expression normalized to β-actin expression for each sample. Data are representative of two independent experiments.
Figure 4.
Figure 4.
Deletion of miR-146a in mice results in autoimmune disorder. (A) Splenomegaly and lymphadenopathy observed in miR-146a−/− mice. Photographs of spleens and peripheral lymph nodes removed from a single representative WT and KO mouse. (B) Spleen weights observed in WT (n = 8), miR-146a+/− (HET; n = 3), and miR-146a−/− (KO; n = 12) animals. Results are shown as means and are representative of two independent experiments. P-value calculation was performed using Student’s t test. (C) Kaplan-Meier survival curves of WT, miR-146a+/− (HET), and miR-146a−/− (KO) mouse populations. P-value calculations were performed using log-rank (Mantel-Cox) test. P-value for WT and KO curve comparison is <0.0001. P-value for WT and HET curve comparison is 0.0041. (D) Multiorgan inflammation in miR-146a−/− mice. Hematoxylin- and eosin-stained sections of liver and kidney from miR-146a+/+ (top) and miR-146a−/− (middle, low magnification; bottom, high magnification) mice. Note the leukocytic infiltrates in the KO liver (circled with dashed lines), compared with a relatively spared portal triad (PT) in the WT liver. At higher magnification, degenerated hepatocytes (marked by arrows) displaying fragmented nuclei and eosinophilic cytoplasm indicate tissue damage caused by the inflammatory infiltrates. Note the large infiltrate of inflammatory cells (circled) in the miR-146a−/− kidney. In the low-power image, the KO tubules appear more eosinophilic, and their lumina are dilated. At higher magnification, a degenerated tubule (marked by arrows) indicates tissue damage caused by the inflammatory infiltrates. Bars: (top and middle) 200 µm; (bottom) 40 µm. (E) ELISA-based analysis of autoantibodies against double-stranded DNA (dsDNA) in the serum of WT (n = 11) and miR-146a−/− (KO; n = 17) animals. Ab, antibody. (F) Analysis of IL-6 levels in serum of miR-146a+/− (HET; n = 15) and miR-146a−/− (KO; n = 21) animals by ELISA. (E and F) Results are shown as means. P-value calculation was performed using Student’s t test. (G) FACS analysis of CD4+ and CD8+ splenocytes from miR-146a+/− and miR-146a−/− animals using anti-CD62, -CD44, and -CD69 antibodies. Gray plot indicates miR-146a+/− cells, and the open plot indicates miR-146a−/− cells. Data are representative of three independent experiments. All experiments were performed using the 129.B6/miR-146a−/− strain of mice.
Figure 5.
Figure 5.
Myeloproliferation and BM failure in aging miR-146a−/− mice. (A) Absolute cell counts of myeloid cells (CD11b+) in WT (n = 7), miR-146a+/− (HET; n = 4), and miR-146a−/− (KO; n = 10) spleens. Results are shown as means and are representative of two independent experiments. (B) FACS analysis of myeloid cells in WT and KO spleens. Gated are Gr1 and CD11b double-positive cells. Numbers indicate percentage of cells in the gate. Data are representative of three independent experiments. (C–J) Complete blood count test with differential examination of peripheral blood from young (∼4 mo old; n = 6 for both genotypes) and old (∼14 mo old; n = 8 for both genotypes) WT and miR-146a−/− (KO) mice. (C) Absolute white blood cell counts. (D) Absolute red blood cell counts. (E) Absolute thrombocyte counts. (F) Absolute neutrophil counts. (G) Absolute lymphocyte counts. (H) Absolute monocyte counts. (I) Hemoglobin concentration. (J) Blood hematocrit. (A and C–J) P-value calculations were performed using Student’s t test. Experiments in B–J were performed using the B6/miR-146a−/− strain of mice. The experiment A was performed in 129.B6/miR-146a−/− mice.
Figure 6.
Figure 6.
miR-146a–null BMDMs proliferate more robustly in response to M-CSF and express more CSF1R on their cell surface. (A) Analysis of myeloid precursor cells by colony-forming cell assays. BM cells from WT and miR-146a–null mice (KO) were grown for 10 d in methylcellulose in the presence of the indicated concentrations of recombinant M-CSF or G-CSF, and the number of macrophage and granulocyte CFUs was scored under a microscope. (B) Photographs of proliferating in response to 50 ng/ml M-CSF BMDM cultures, derived from WT and miR-146a−/− (KO) mice. Pictures were taken on day 3 after cell plating and are representative of several biological replicates. Data are representative of two independent experiments. (C) Quantification of cellular proliferation of differentiating BMDM cultures from WT and miR-146a−/− (KO) mice in response to 50 ng/ml M-CSF. Three age- and gender-matched mice were used per genotype. Cell proliferation was assessed by MTS assay on day 3 after cell plating. Data are representative of two independent experiments. (A and C) Data are represented as mean ± SD. (D) FACS analysis of cell surface CSF1R expression on BMDM cells, derived from three WT and three miR-146a−/− (KO) mice as described in C. Cells were pregated for CD11b and F4/80 markers first. Data are representative of two independent experiments. All experiments were performed using the B6/miR-146a−/− strain of mice.
Figure 7.
Figure 7.
Increased rate of tumorigenesis in mice as a result of miR-146a ablation. (A) Photograph of spleens isolated form representative WT and miR-146a−/− (KO) mice; arrows are pointing at frank tumors. (B–E) Hematoxylin- and eosin-stained sections of two independent tumors isolated from miR-146a−/− mice showing features of diffuse large cell hematolymphoid neoplasms. The lower-power images show diffuse infiltrate without any architecture, whereas at higher magnification, the cells are very large with nuclei approaching 20 µm in size. Bars: (B and D) 400 µm; (C and E) 40 µm. (F) Rates of neoplasm occurrence in cohorts of aging miR-146a+/+ (n = 42; mean age = 537 d) and miR-146a−/− (n = 45; mean age = 571 d) mice. P-value calculation was performed using two-tailed Fisher’s exact test. All experiments were carried with 129.B6/miR-146a−/− mice.

References

    1. Aikawa Y., Katsumoto T., Zhang P., Shima H., Shino M., Terui K., Ito E., Ohno H., Stanley E.R., Singh H., et al. 2010. PU.1-mediated upregulation of CSF1R is crucial for leukemia stem cell potential induced by MOZ-TIF2. Nat. Med. 16:580–585: 1p: 585 10.1038/nm.2122 - DOI - PMC - PubMed
    1. Ambros V. 2004. The functions of animal microRNAs. Nature. 431:350–355 10.1038/nature02871 - DOI - PubMed
    1. Baek D., Villén J., Shin C., Camargo F.D., Gygi S.P., Bartel D.P. 2008. The impact of microRNAs on protein output. Nature. 455:64–71 10.1038/nature07242 - DOI - PMC - PubMed
    1. Balkwill F., Mantovani A. 2001. Inflammation and cancer: back to Virchow? Lancet. 357:539–545 10.1016/S0140-6736(00)04046-0 - DOI - PubMed
    1. Baltimore D., Boldin M.P., O’Connell R.M., Rao D.S., Taganov K.D. 2008. MicroRNAs: new regulators of immune cell development and function. Nat. Immunol. 9:839–845 10.1038/ni.f.209 - DOI - PubMed

Publication types

MeSH terms