

Methane contamination of drinking water accompanying gas-well drilling and hydraulic fracturing
- PMID: 21555547
- PMCID: PMC3100993
- DOI: 10.1073/pnas.1100682108
Methane contamination of drinking water accompanying gas-well drilling and hydraulic fracturing
Abstract
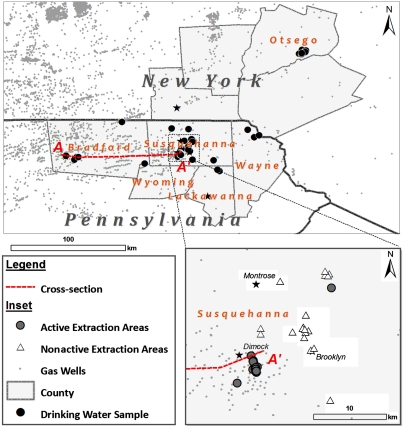
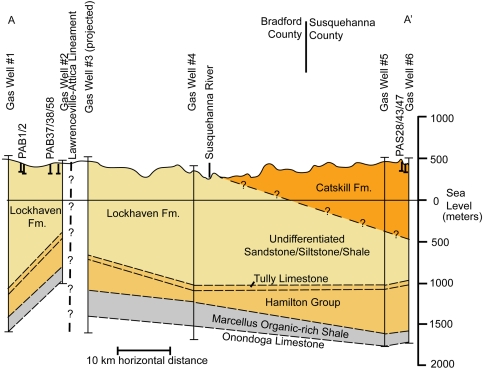
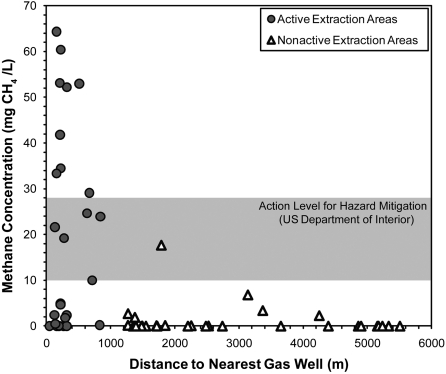
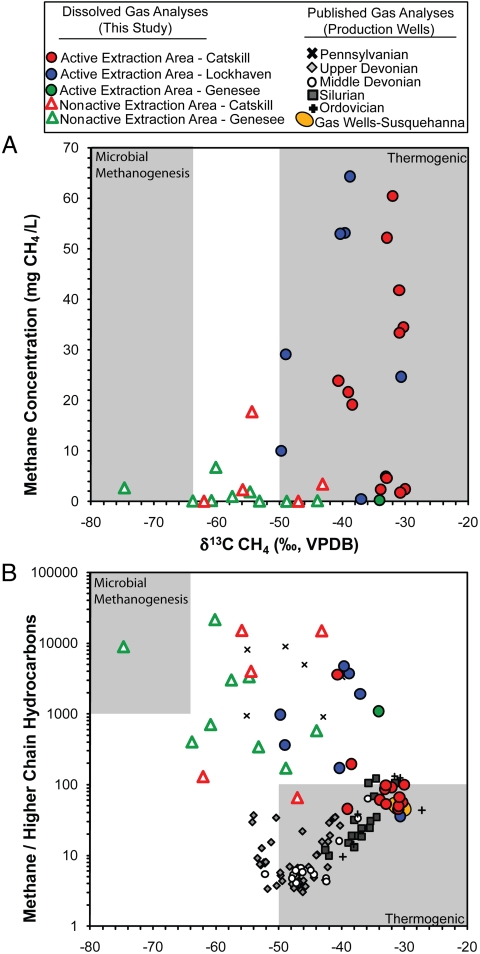
Directional drilling and hydraulic-fracturing technologies are dramatically increasing natural-gas extraction. In aquifers overlying the Marcellus and Utica shale formations of northeastern Pennsylvania and upstate New York, we document systematic evidence for methane contamination of drinking water associated with shale-gas extraction. In active gas-extraction areas (one or more gas wells within 1 km), average and maximum methane concentrations in drinking-water wells increased with proximity to the nearest gas well and were 19.2 and 64 mg CH(4) L(-1) (n = 26), a potential explosion hazard; in contrast, dissolved methane samples in neighboring nonextraction sites (no gas wells within 1 km) within similar geologic formations and hydrogeologic regimes averaged only 1.1 mg L(-1) (P < 0.05; n = 34). Average δ(13)C-CH(4) values of dissolved methane in shallow groundwater were significantly less negative for active than for nonactive sites (-37 ± 7‰ and -54 ± 11‰, respectively; P < 0.0001). These δ(13)C-CH(4) data, coupled with the ratios of methane-to-higher-chain hydrocarbons, and δ(2)H-CH(4) values, are consistent with deeper thermogenic methane sources such as the Marcellus and Utica shales at the active sites and matched gas geochemistry from gas wells nearby. In contrast, lower-concentration samples from shallow groundwater at nonactive sites had isotopic signatures reflecting a more biogenic or mixed biogenic/thermogenic methane source. We found no evidence for contamination of drinking-water samples with deep saline brines or fracturing fluids. We conclude that greater stewardship, data, and-possibly-regulation are needed to ensure the sustainable future of shale-gas extraction and to improve public confidence in its use.
Conflict of interest statement
The authors declare no conflict of interest.
Figures
Comment in
-
Lack of data to support a relationship between methane contamination of drinking water wells and hydraulic fracturing.Proc Natl Acad Sci U S A. 2011 Sep 13;108(37):E663; author reply E665-6. doi: 10.1073/pnas.1108435108. Epub 2011 Aug 30. Proc Natl Acad Sci U S A. 2011. PMID: 21878568 Free PMC article. No abstract available.
-
Hydraulic fracturing not responsible for methane migration.Proc Natl Acad Sci U S A. 2011 Sep 13;108(37):E664; author reply E665-6. doi: 10.1073/pnas.1107960108. Epub 2011 Aug 30. Proc Natl Acad Sci U S A. 2011. PMID: 21878569 Free PMC article. No abstract available.
-
Methane contamination of drinking water caused by hydraulic fracturing remains unproven.Proc Natl Acad Sci U S A. 2011 Oct 25;108(43):E871; author reply E872. doi: 10.1073/pnas.1113299108. Epub 2011 Oct 14. Proc Natl Acad Sci U S A. 2011. PMID: 22003124 Free PMC article. No abstract available.
References
-
- Pacala S, Socolow R. Stabilization wedges: Solving the climate problem for the next 50 years with current technologies. Science. 2004;305:968–972. - PubMed
-
- Tour JM, Kittrell C, Colvin VL. Green carbon as a bridge to renewable energy. Nature Mater. 2010;9:871–874. - PubMed
-
- Kerr RA. Natural gas from shale bursts onto the scene. Science. 2010;328:1624–1626. - PubMed
-
- US Energy Information Administration. Annual Energy Outlook 2010 with Projections to 2035. Washington, DC: US Energy Information Administration; 2010. DOE/EIA-0383; http://www.eia.doe.gov/oiaf/aeo/pdf/0383(2010).pdf.
Publication types
MeSH terms
Substances
LinkOut - more resources
Full Text Sources
Other Literature Sources
