. 2011 Jun;121(6):2350-60.
doi: 10.1172/JCI46102. Epub 2011 May 9.

Exhaustion of tumor-specific CD8⁺ T cells in metastases from melanoma patients

Affiliations

Exhaustion of tumor-specific CD8⁺ T cells in metastases from melanoma patients

Lukas Baitsch et al. J Clin Invest. 2011 Jun.

Abstract

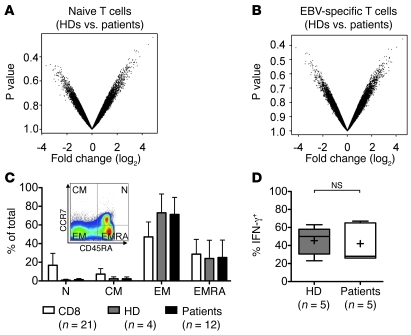
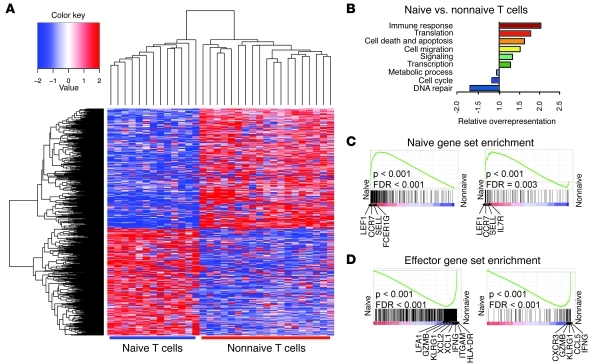
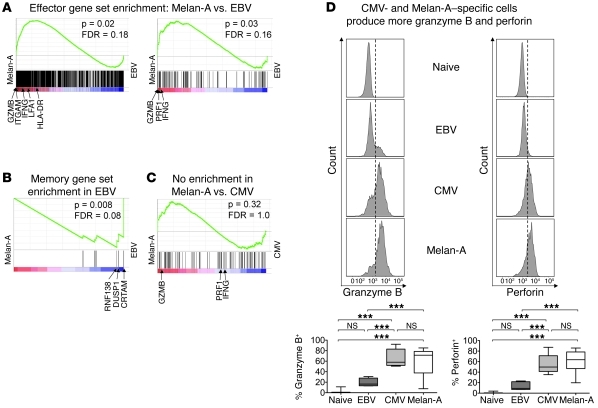
In chronic viral infections, CD8⁺ T cells become functionally deficient and display multiple molecular alterations. In contrast, only little is known of self- and tumor-specific CD8⁺ T cells from mice and humans. Here we determined molecular profiles of tumor-specific CD8⁺ T cells from melanoma patients. In peripheral blood from patients vaccinated with CpG and the melanoma antigen Melan-A/MART-1 peptide, we found functional effector T cell populations, with only small but nevertheless significant differences in T cells specific for persistent herpesviruses (EBV and CMV). In contrast, Melan-A/MART-1-specific T cells isolated from metastases from patients with melanoma expressed a large variety of genes associated with T cell exhaustion. The identified exhaustion profile revealed extended molecular alterations. Our data demonstrate a remarkable coexistence of effector cells in circulation and exhausted cells in the tumor environment. Functional T cell impairment is mediated by inhibitory receptors and further molecular pathways, which represent potential targets for cancer therapy.


Figures

Figure 1
Figure 1. Naive and virus-specific T cells show no significant differences between melanoma patients and healthy donors.
(A and B) Volcano plots for all gene probes on the microarray, showing expression differences and P values of naive T cells (healthy donors [HDs] versus patients; A) or EBV-specific T cells (healthy donors versus patients; B). Each point represents 1 gene probe. (C) Lymphocytes were stained with an A2/EBV BMLF1280–288 tetramer together with anti-CD8, anti-CD45RA, and anti-CCR7. The inset shows a dot plot distinguishing the phenotypes among total CD8+ T cells analyzed as controls: naive (N) (CD45RA+CCR7+), central memory (CM) (CD45RACCR7+), effector memory (EM) (CD45RACCR7) and effector memory RA+ cells (EMRA) (CD45RA+CCR7). Bar graph depicts the percentage (mean ± SD) of each phenotype of total CD8+ cells or total EBV tetramer-positive populations from healthy donors or patients. (D) IFN-γ production by EBV-specific T cells upon 4-hour stimulation. Whiskers in box plots indicate maximum and minimum values measured. Cross indicates the mean, while line indicates the median.
Figure 2
Figure 2. Gene expression of naive and effector T cells from peripheral blood.
(A) Two-way hierarchical clustering based on the identified 773 genes, separating all naive from nonnaive T cells. Red indicates overexpression and blue underexpression relative to the mean. Each row represents 1 gene and each column 1 1,000-cell sample from 1 patient or healthy donor. (B) Relative overexpression of GO terms associated with the identified genes, calculated as described in Methods. (C and D) GSEA of publicly available gene sets describing naive and effector T cells. Positions of selected example genes are indicated. Gene sets comprise genes enriched in naive T cells (C) or in effector cells (D). Genes to the left and right of the rank-ordered list are enriched in naive T cells and nonnaive T cells, respectively.
Figure 3
Figure 3. Gene expression of circulating CD8+ T cells depending on antigen specificity.
(A and B) Volcano plots for all gene probes, showing differential expression and P values of the comparison of tumor- versus EBV-specific T cells (A) or tumor- versus CMV-specific T cells (B); diagramming is similar to that in Figure 1. (C and D) Two-way hierarchical clustering based on the identified gene probes separating all tumor-specific T cells from EBV- (C, 405 gene probes corresponding to 390 genes) and from CMV-specific T cells (D, 187 gene probes corresponding to 184 genes). Red indicates overexpression and blue underexpression relative to the mean. Each row represents 1 gene and each column 1 1,000-cell sample from 1 patient (tumor-, EBV- and CMV-specific cells) or healthy donor (EBV-specific cells, n = 4). (E and G) Log fold changes between tumor- and EBV- (E) or tumor- and CMV-specific T cells (G) of data from microarrays (blue bars) and qPCR (red bars). Positive and negative values indicate overexpression in tumor- and in virus-specific T cells, respectively. Data are represented as mean ± SEM. (F and H) Relative overexpression of GO terms associated with the identified 390 genes (Melan-A/MART-1 versus EBV; F) or with the identified 184 genes (Melan-A/MART-1 versus CMV; H), calculated as described in Methods.
Figure 4
Figure 4. Circulating tumor-specific T cells are late-differentiated effector cells, resembling CMV-specific T cells.
(A) Gene set enrichment of genes describing effector cells (see Figure 2D). Genes to the left and right of the rank-ordered list are enriched in tumor- and EBV-specific T cells, respectively. (B) Gene set enrichment of genes describing memory cells (2). Genes to the left and right of the rank-ordered list are enriched in tumor- and EBV-specific T cells, respectively. (C) No differences were found between Melan-A/MART-1– and CMV-specific T cells, demonstrated by a gene set defining effector cell–related genes (31). (D) Intracellular staining of naive and antigen-specific T cells. Top panels show 1 representative example; below are the combined results of all samples (EBV and CMV, n = 5; Melan-A, n = 15; naive, n = 25). Data of EBV- and CMV-specific T cells are from healthy donors, while data of tumor-specific T cells are from patients. ***P < 0.001. Whiskers in box plots indicate maximum and minimum values measured. Line indicates the median.
Figure 5
Figure 5. Exhaustion profile of tumor-specific T cells in situ.
(A) IFN-γ production by tumor-specific T cells from the circulation (blood; n = 6) or TILN (n = 8) after 4-hour antigen stimulation. Whiskers in box plots indicate maximum and minimum values measured. Cross indicates the mean, while line indicates the median. **P < 0.01. (B) Differential gene expression by tumor-specific T cells isolated from blood versus TILN, as illustrated by a volcano plot for all gene probes. (C) Two-way hierarchical clustering based on the identified 346 genes separating all blood-derived tumor-specific T cells from their TILN counterparts. Red indicates overexpression and blue underexpression relative to the mean. Each row represents 1 gene and each column 1 1,000-cell sample from 1 patient. (D) Log fold change between tumor-specific T cells from blood versus TILN; data from microarrays (blue bars) and qPCR (red bars). Positive and negative values indicate overexpression in tumor-specific T cells from TILN and from blood, respectively. Mean ± SEM. (E) Relative overexpression of GO terms associated with the identified genes, calculated as described in Methods. (F) Enrichment of the gene set described for exhausted T cells (2) in TILN-derived tumor-specific T cells, relative to their blood-derived counterparts. The positions of inhibitory receptors found in this gene set on the rank-ordered gene list are indicated. A position to the left indicates enrichment in TILN-derived cells, a position to the right enrichment in blood-derived cells.
Figure 6
Figure 6. Multi-tetramer staining assessing coexpression of inhibitory receptors.
(A) Staining with tetramers binding to EBV- (PE–Texas Red), Melan-A/MART-1– (APC–eFluor 780), or CMV- (PE–Texas Red and APC–eFluor 780) specific T cells (labeling tetramers with 2 instead of 1 fluorochrome identifies larger numbers of epitope-specific T cell populations than the number of fluorescence channels used). T cells were analyzed for coexpression of 7 inhibitory receptors: KLRG-1 (Alexa Fluor 488), TIM-3 (PE), PD-1 (PerCP-eFluor710), and CD160 (Alexa Fluor 647), or LAG-3 (FITC), 2B4 (PE-Cy5.5), and CTLA-4 (APC). (B) Expression of 7 different inhibitory receptors. Histograms of a representative sample are gated on CD8+ tetramer+ cells. Box plots summarize the data of all patients analyzed (EBV, n = 16; CMV, n = 6; Melan-A blood, n = 10, except for CTLA-4, n = 3; Melan-A TILN, n = 8–9). Whiskers in box plots indicate the maximum and minimum values measured. Cross indicates the mean, while line indicates the median. *P < 0.05; #P < 0.01; §P < 0.001. (C) Coexpression of 0 to 4 and 0 to 3 inhibitory receptors was analyzed with SPICE (48).

References

    1. Kim PS, Ahmed R. Features of responding T cells in cancer and chronic infection. Curr Opin Immunol. 2010;22(2):223–230. doi: 10.1016/j.coi.2010.02.005. - DOI - PMC - PubMed
    1. Wherry EJ, et al. Molecular signature of CD8+ T cell exhaustion during chronic viral infection. Immunity. 2007;27(4):670–684. doi: 10.1016/j.immuni.2007.09.006. - DOI - PubMed
    1. Turner SJ, Kedzierska K, La Gruta NL, Webby R, Doherty PC. Characterization of CD8+ T cell repertoire diversity and persistence in the influenza A virus model of localized, transient infection. Semin Immunol. 2004;16(3):179–184. doi: 10.1016/j.smim.2004.02.005. - DOI - PubMed
    1. Gallimore A, Hengartner H, Zinkernagel R. Hierarchies of antigen-specific cytotoxic T cell responses. Immunol Rev. 1998;164:29–36. doi: 10.1111/j.1600-065X.1998.tb01205.x. - DOI - PubMed
    1. Yewdell JW, Bennink JR. Immunodominance in major histocompatibility complex class I-restricted T lymphocyte responses. Annu Rev Immunol. 1999;17:51–88. doi: 10.1146/annurev.immunol.17.1.51. - DOI - PubMed

Publication types

MeSH terms

Associated data