. 2011:2:300.
doi: 10.1038/ncomms1302.

Engineering biosynthetic excitable tissues from unexcitable cells for electrophysiological and cell therapy studies

Affiliations

Engineering biosynthetic excitable tissues from unexcitable cells for electrophysiological and cell therapy studies

Robert D Kirkton et al. Nat Commun. 2011.

Abstract

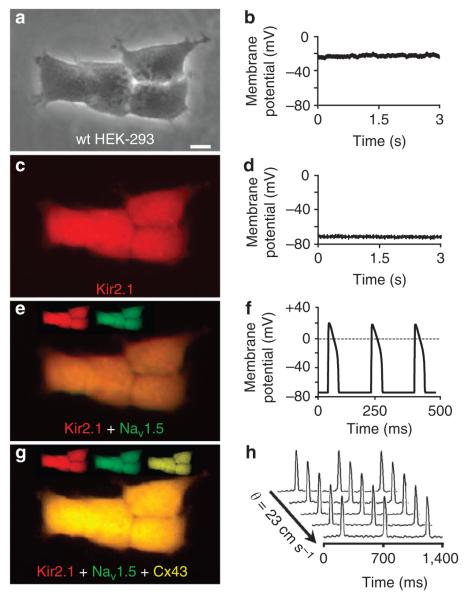
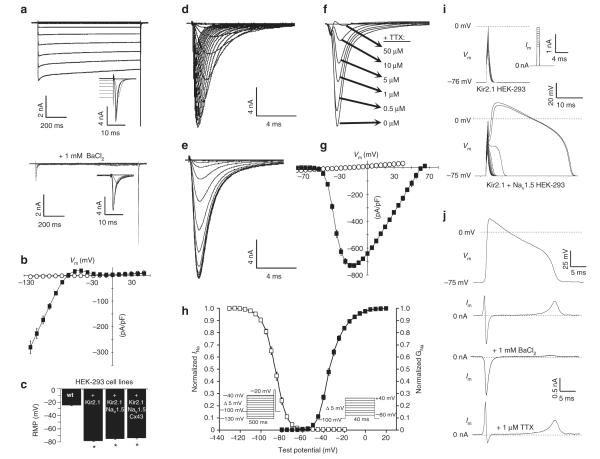
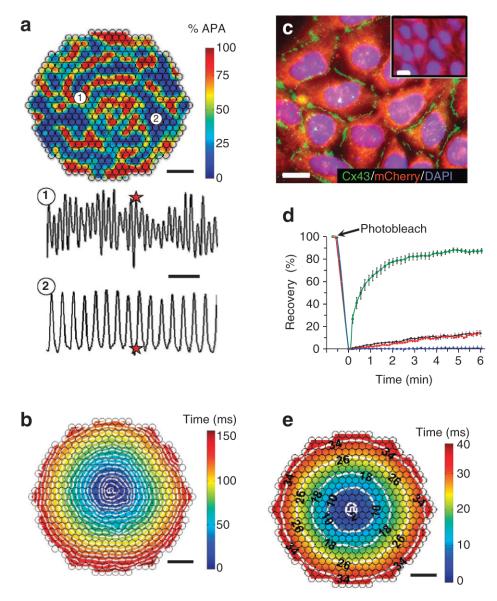
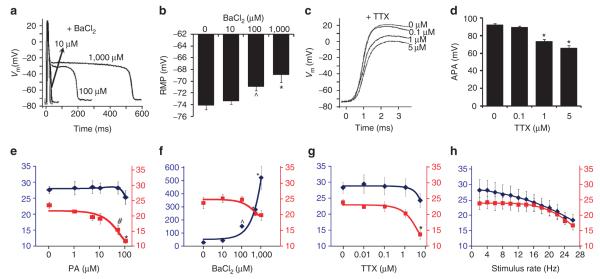
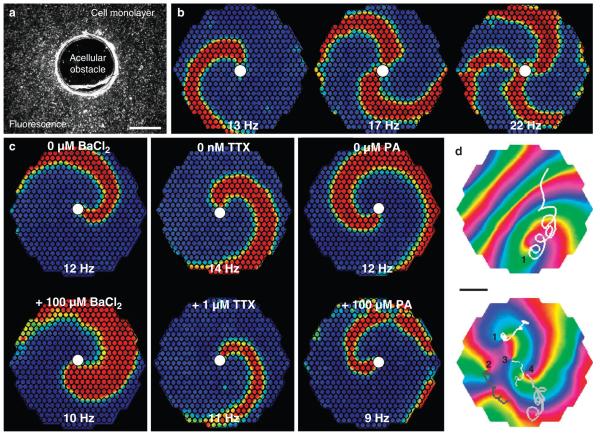
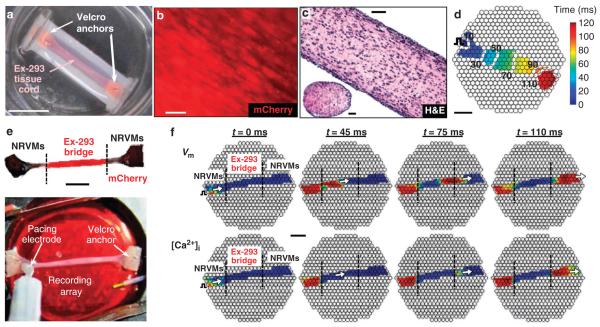
Patch-clamp recordings in single-cell expression systems have been traditionally used to study the function of ion channels. However, this experimental setting does not enable assessment of tissue-level function such as action potential (AP) conduction. Here we introduce a biosynthetic system that permits studies of both channel activity in single cells and electrical conduction in multicellular networks. We convert unexcitable somatic cells into an autonomous source of electrically excitable and conducting cells by stably expressing only three membrane channels. The specific roles that these expressed channels have on AP shape and conduction are revealed by different pharmacological and pacing protocols. Furthermore, we demonstrate that biosynthetic excitable cells and tissues can repair large conduction defects within primary 2- and 3-dimensional cardiac cell cultures. This approach enables novel studies of ion channel function in a reproducible tissue-level setting and may stimulate the development of new cell-based therapies for excitable tissue repair.


Figures

Figure 1
Figure 1. Stable coexpression of three genes confers impulse conduction in unexcitable cells
wt HEK-293 cells (a), like most unexcitable cells, have a relatively depolarized resting potential (b). scale bar, 10 μm. stable expression of Kir2.1-IREs-mCherry (c) introduces inward-rectifier potassium current in the cell yielding membrane hyperpolarization (d). Coexpression of nav1.5–IREs–GFP (e) introduces fast sodium current that allows firing of regenerative APs on stimulation (f). The additional expression of Cx43–IREs–morange (g) enhances cell–cell coupling and enables fast and uniform AP propagation (h) in multicellular tissues. θ, Velocity of AP propagation.
Figure 2
Figure 2. Stable expression of Kir2.1 and Nav1.5 yields membrane excitability in HEK-293 cells
(a) Kir2.1 + nav1.5 HEK-293 cells exhibited BaCl2-sensitive IK1. Activation of Ina also occurred at the end of several IK1 test pulses (insets). (b) steady-state IK1–V curves obtained from Kir2.1 + nav1.5 (black squares; n = 9) and wt (white circles; n = 6) HEK-293 cells. (c) Expression of IK1 yielded significant hyperpolarization of RmP (n = 10–27). Representative recordings of Ina activation (d), inactivation (e) and TTX block (f) in Kir2.1 + nav1.5 HEK-293 cells. (g) Peak Ina–V curves obtained from Kir2.1 + nav1.5 (black squares; n = 6) and wt HEK-293 (white circles; n = 6) cells. (h) Voltage dependence of Ina steady-state activation (black squares; n = 6) and inactivation (white squares; n = 6). (i) Current pulses (inset) induced an all-or-none AP response in Kir2.1 + nav1.5 but not in Kir2.1 HEK-293 cells. (j) AP-clamp recordings in Kir2.1 + nav1.5 HEK-293 cells revealed the individual contributions of Ina and IK1 to the AP. Error bars denote mean ± s.e.m.; *P < 0.001; #P < 0.01; and ^P < 0.05. All recordings shown were made using the same monoclonal Kir2.1 + nav1.5 HEK-293 cell line.
Figure 3
Figure 3. Stable overexpression of Cx43 in Kir2.1 + Nav1.5 HEK-293 cells yields enhanced intercellular coupling and permits rapid AP propagation
(a) At the start of recording, confluent isotropic 2D networks (monolayers) of monoclonal Kir2.1 + nav1.5 cells usually exhibited high-frequency unorganized electrical activity caused by numerous, slowly moving, splitting and colliding waves. shown is one instant of optically recorded transmembrane voltage. Colour bar indicates percent AP amplitude (% APA). Different sites in the monolayer (for example, 1 and 2) activated at different rates (bottom panel), demonstrating the lack of spatial synchrony in activation. Red stars denote the time at which the transmembrane voltage frame (top panel) was taken. scale bars indicate 3 mm (top panel) and 250 ms (bottom panel). (b) on successful termination of all unorganized activity by a strong field shock, low-frequency ( < 10 Hz) point stimulation from the centre (white pulse sign) yielded slow conduction through the weakly coupled Kir2.1 + nav1.5 HEK-293 cells. shown is a colour-coded map of cell activation, with white isochrone lines drawn at every 8 ms. scale bar, 3 mm. (c) Following stable Cx43 overexpression, the derived Kir2.1 + nav1.5 + Cx43 HEK-293 cells formed abundant intercellular Cx43 gap junctions (green), which were not detected in wt HEK-293 cells (inset). scale bars, 10 μm. (d) Fluorescence recovery after photobleaching shows increased functional coupling in monoclonal Kir2.1 + nav1.5 + Cx43 (Ex-293) cells (green squares; n = 7) compared with wt HEK-293 (black diamonds; n = 6) and Kir2.1 + nav1.5 HEK-293 (red triangles; n = 5) cells. Palmitoleic acid (PA) inhibited junctional coupling and fluorescence recovery (blue circles; n = 6). Error bars denote s.e.m. (e) Pacing in the centre of an Ex-293 monolayer elicited rapid and uniform AP spread (see supplementary movie 1). scale bar, 3 mm. Isochrones of cell activation (white lines) are labelled in milliseconds. small black circles in a, b, and e denote 504 optical recording sites. DAPI, 4,6-diamidino-2-phenylindole.
Figure 4
Figure 4. Effects of channel blockers on the shape and conduction of APs in Ex-293 monolayers
(ad) Dose-dependent effects of IK1 or Ina inhibition on the shape of propagated APs, recorded by sharp microelectrodes during 1-Hz stimulation. Inhibition of IK1 by increasing doses of BaCl2 significantly prolonged AP duration (representative cell shown in a) and depolarized RmP (b; n = 11–20). The rapid AP repolarization at high doses of BaCl2 was likely contributed by the endogenous outward currents of HEK-293 cells (supplementary Fig. s2). Inhibition of Ina by increasing doses of TTX decreased AP upstroke (representative cell shown in c) and amplitude (d; n = 8–34). (eg) Dose-dependent effects of specific channel blockers on CV (red squares) and AP duration (APD80, blue diamonds) in optically mapped Ex-293 monolayers during 1-Hz stimulation (n = 5–7). Left (blue) and right (red) y axes correspond to APD80 (ms) and CV (cm s − 1), respectively. Highest doses shown are before conduction blocks occurred. (h) Effect of increased stimulation rate on CV (red squares) and APD80 (blue diamonds). The rate was increased in 1-min steps, and data from all recording sites were averaged during the last 2 s of each step (n = 5 monolayers). Error bars denote mean ± s.e.m.; *P < 0.001; #P < 0.01; and ^P < 0.05 vs corresponding drug-free values. Additional data for the effects of channel inhibition on AP shape and conduction are shown in supplementary Figures s5 and s6.
Figure 5
Figure 5. Spiral waves in Ex-293 monolayers
(a) Coverslips with a 1.6-mm punched central hole were used to generate monolayers with an acellular obstacle. scale bar, 1 mm. (b) short bursts of rapid point stimulation ( > 25 Hz) from the monolayer periphery yielded formation of single or multiple spiral waves that anchored to the central obstacle (white circle) and rotated at shown rates. (c) monolayers with a single stable anchored spiral were exposed to BaCl2, TTX or PA to decrease IK1, Ina or gap junctional coupling, respectively. The application of each blocker slowed spiral rotation, with BaCl2 also causing an increase in AP duration (as evidenced by an increase in spiral wave width). Higher doses of the three compounds eventually terminated the spiral activity. Frames in b and c show colour-coded optically recorded transmembrane voltage (blue to red denote rest to peak of AP), whereas small circles within these frames denote optical recording sites. (d) In the absence of a central obstacle, rapid stimulation occasionally caused the formation of single (top panel, shown in an anisotropic monolayer) or multiple (bottom panel shown in an isotropic monolayer) freely drifting spiral waves. Drift trajectories (overlay lines) of individual spiral tips (labelled by numbers) were tracked using phase map analysis and shown over a period of ~400 ms. The colours in the phase map denote different phases of the AP, with red colour showing the AP wave front. scale bar, 4 mm. Representative movies of spiral waves are compiled in supplementary movie 2.
Figure 6
Figure 6. Ex-293 cells form 3D biosynthetic excitable tissues and establish active electrical connection between remote regions in a 3D cardiac network
(a) A 3D tissue cord made by casting a mixture of Ex-293 cells and fibrin hydrogel within a tubular mold. scale bar, 1 cm. (b) Longitudinal alignment of Ex-293 cells under passive tension inside a tissue cord. scale bar, 50 μm. (c) Longitudinal and transverse histological sections of an Ex-293 tissue cord cultured for 4 weeks and stained with haematoxylin and eosin (H&E). scale bars, 100 μm. (d) Point pacing at the periphery of an Ex-293 tissue cord (pulse sign) elicited rapid and uniform AP propagation (see supplementary movie 3). Isochrones of cell activation (white lines) are labelled in milliseconds. small black circles denote optical recording sites. scale bar, 3 mm. (e) A cocultured-3D tissue cord with peripheral nRVm regions connected by a 1.3-cm-long central Ex-293 bridge (superimposed composite images of phase contrast and mCherry fluorescence). scale bar, 5 mm. The optical recording array was placed underneath the cord (bottom panel). (f) stimulation of a proximal nRVm region (left panel) generated a wave of transmembrane voltage (Vm) that spread (as shown by white arrow) through the Ex-293 tissue bridge and into the distal nRVm region (top frames). nRVm (but not Ex-293) excitation also yielded generation of intracellular calcium ([Ca2 + ]i) transients (bottom frames). Frames show colour-coded Vm or [Ca2 + ]i optically recorded at times shown above (blue to red indicate baseline to peak signal, respectively). scale bar, 3 mm. Additional proof-of-concept examples where remote nRVm regions in 2D cultures are seamlessly connected by active AP propagation through Ex-293 cells are shown in supplementary Figure s7 and supplementary movie 4.

Similar articles

Cited by

References

    1. Hille B. Ion Channels of Excitable Membranes. Sinauer; 2001.
    1. Catterall WA. The molecular basis of neuronal excitability. Science. 1984;223:653–661. - PubMed
    1. Kleber AG, Rudy Y. Basic mechanisms of cardiac impulse propagation and associated arrhythmias. Physiol. Rev. 2004;84:431–488. - PubMed
    1. Kass RS. The channelopathies: novel insights into molecular and genetic mechanisms of human disease. J. Clin. Invest. 2005;115:1986–1989. - PMC - PubMed
    1. Lloyd-Jones D, et al. Heart disease and stroke statistics--2010 update: a report from the American Heart Association. Circulation. 2010;121:e46–e215. - PubMed

Publication types