. 2011 May 10:7:488.
doi: 10.1038/msb.2011.20.

Stimulus-dependent dynamics of p53 in single cells

Affiliations

Stimulus-dependent dynamics of p53 in single cells

Eric Batchelor et al. Mol Syst Biol. .

Abstract

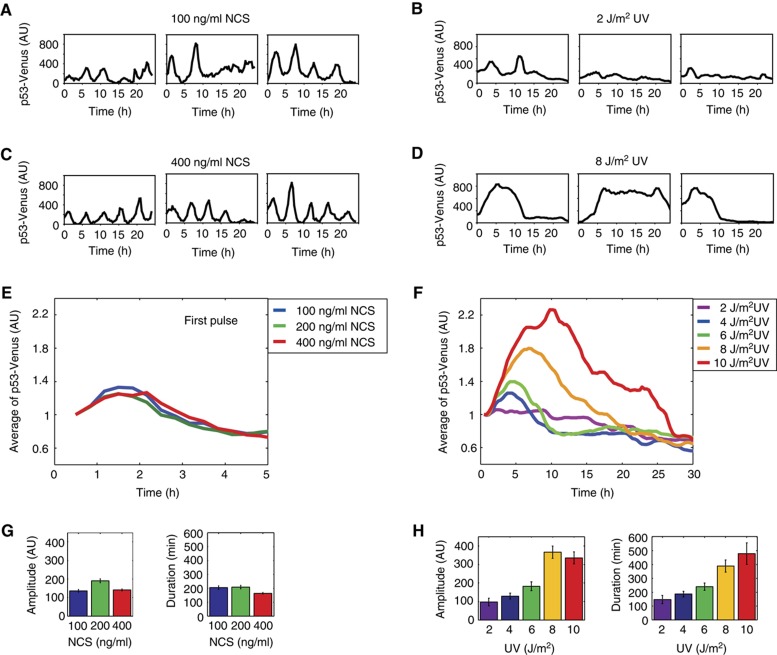
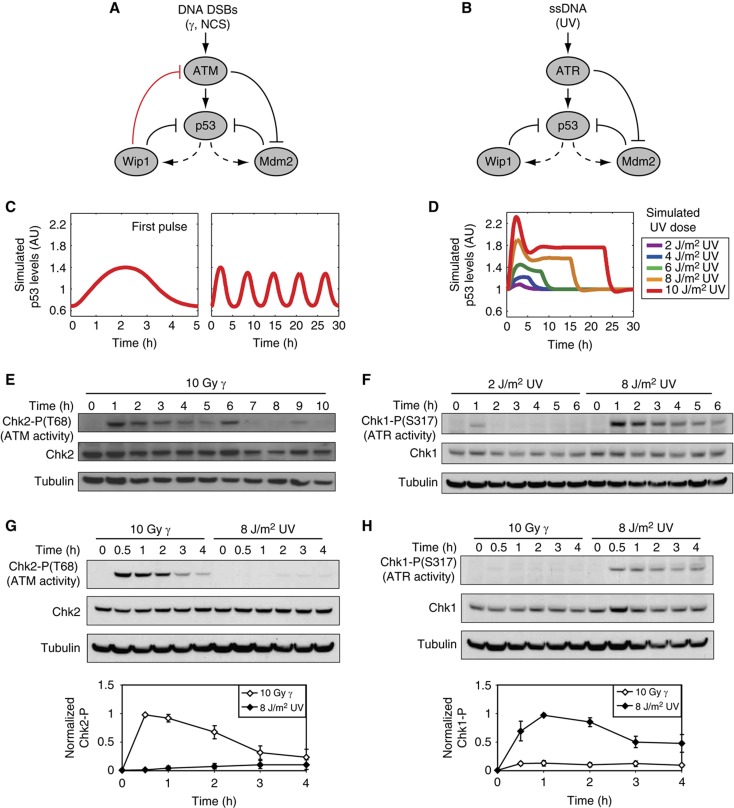
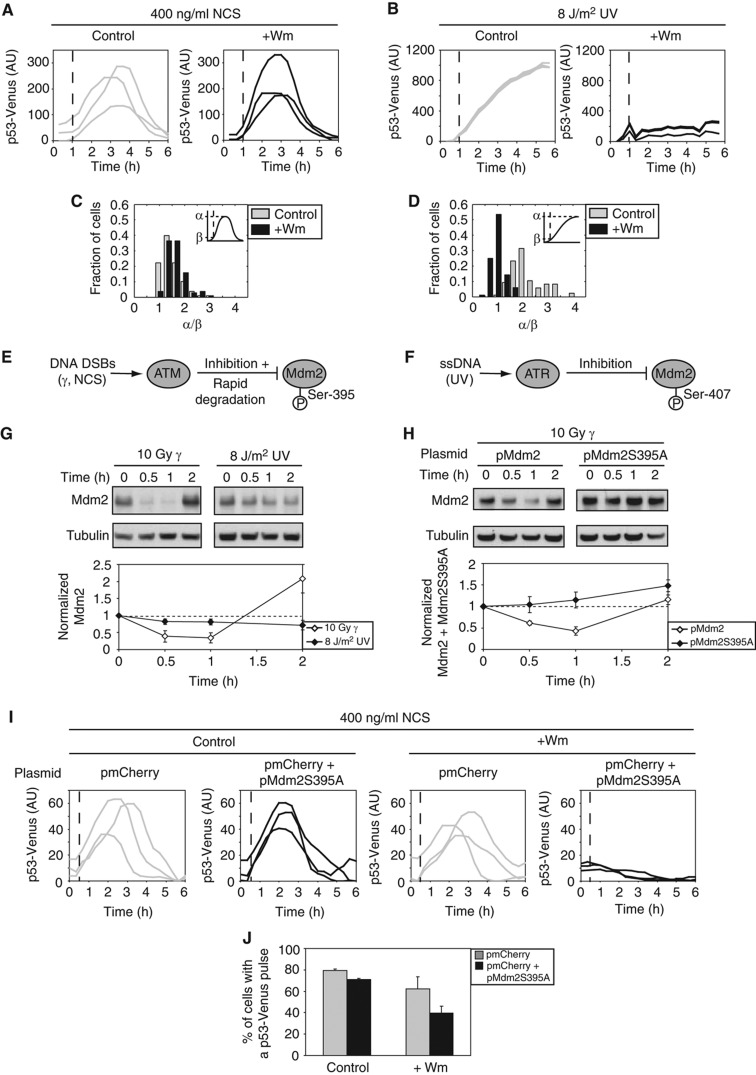
Many biological networks respond to various inputs through a common signaling molecule that triggers distinct cellular outcomes. One potential mechanism for achieving specific input-output relationships is to trigger distinct dynamical patterns in response to different stimuli. Here we focused on the dynamics of p53, a tumor suppressor activated in response to cellular stress. We quantified the dynamics of p53 in individual cells in response to UV and observed a single pulse that increases in amplitude and duration in proportion to the UV dose. This graded response contrasts with the previously described series of fixed pulses in response to γ-radiation. We further found that while γ-triggered p53 pulses are excitable, the p53 response to UV is not excitable and depends on continuous signaling from the input-sensing kinases. Using mathematical modeling and experiments, we identified feedback loops that contribute to specific features of the stimulus-dependent dynamics of p53, including excitability and input-duration dependency. Our study shows that different stresses elicit different temporal profiles of p53, suggesting that modulation of p53 dynamics might be used to achieve specificity in this network.


Conflict of interest statement

The authors declare that they have no conflict of interest.

Figures

Figure 1
Figure 1
Stimulus-dependent dynamics of p53 in response to NCS (DSBs) and to UV. (AD) Representative traces of MCF7 cells expressing p53-Venus exposed to 100 (A) or 400 ng/ml (C) of NCS or to 2 (B) or 8 J/m2 (D) UV at the indicated time following treatment. (E, F) p53-Venus levels averaged over the traces of cells in response to various levels of NCS and UV. Note that for NCS, the averaged response is shown only for the first p53 pulse, as synchrony between cells is lost in subsequent pulses. Each experiment includes between 60 and 110 cells. The mean trace was normalized to the mean p53-Venus of the first time point. (G, H) Quantification of the relative amplitude and full-width half-maximum duration of all p53 pulses in response to NCS (G) or the first pulse in response to UV (H). Error bars represent s.e.m.
Figure 2
Figure 2
A single feedback switches repeated, fixed p53 pulses into a single dose-dependent pulse. (A, B) Diagrams showing key species of the p53 signaling networks in response to DSBs (A) and UV (B). Dashed lines indicate transcription; solid lines indicate protein–protein interactions. (C, D) Simulated p53 levels in response to DSBs (C) and UV (D). See Supplementary information for a description of the model. (EH) Western blot analysis of ATM activity (measured by Chk2-P) and ATR activity (measured by Chk1-P) in cells irradiated with γ or UV. Quantification of Chk1-P and Chk2-P levels were normalized to tubulin levels. Error bars represent s.e.m. of triplicate experiments.
Figure 3
Figure 3
Differential p53 excitability between DSBs and UV results from differential regulation of Mdm2. (AD) Cells expressing p53-Venus were treated with NCS (A) or UV (B). One hour after damage, medium containing DMSO (control) or wortmannin (+Wm) (Sarkaria et al, 1998) was added (dashed line). Representative single-cell traces of average p53-Venus intensity are shown for each condition. (C) Histogram of the ratio of peak p53-Venus intensity, α, to p53-Venus intensity at time of DMSO or Wm addition, β, for the experiment shown in (A) (>100 cells/condition). (D) Histogram of the ratio of p53-Venus intensity at 6 h after UV, α, to p53-Venus intensity at time of DMSO or Wm addition, β, for the experiment shown in (B) (>80 cells/condition). (E, F) Diagrams showing the differences in the negative regulation of Mdm2 by ATM (E) and ATR (F). (G) Western blot analysis and quantification of Mdm2 levels in cells irradiated with γ or UV. Error bars represent s.e.m. of triplicate experiments. (H) Western blot analysis and quantification of WT and mutant Mdm2 levels following γ treatment. Note that bands include both endogenous and exogenous Mdm2 or Mdm2S395A. Error bars represent s.e.m. of triplicate experiments. (I) Representative traces of average p53-Venus intensity for cells transfected with control or mutant Mdm2 plasmid in response to NCS. DMSO (control) or wortmannin (+Wm) was added 30 min after NCS treatment (dashed line). (J) The percentage of cells that show a p53-Venus pulse for the experiment in (I) (60–100 cells/condition). Error bars represent s.e.m.

Similar articles

Cited by

References

    1. Barak Y, Juven T, Haffner R, Oren M (1993) mdm2 expression is induced by wild type p53 activity. EMBO J 12: 461–468 - PMC - PubMed
    1. Batchelor E, Mock CS, Bhan I, Loewer A, Lahav G (2008) Recurrent initiation: a mechanism for triggering p53 pulses in response to DNA damage. Mol Cell 30: 277–289 - PMC - PubMed
    1. Bode AM, Dong Z (2004) Post-translational modification of p53 in tumorigenesis. Nat Rev Cancer 4: 793–805 - PubMed
    1. Brooks CL, Gu W (2003) Ubiquitination, phosphorylation and acetylation: the molecular basis for p53 regulation. Curr Opin Cell Biol 15: 164–171 - PubMed
    1. Cimprich KA, Cortez D (2008) ATR: an essential regulator of genome integrity. Nat Rev Mol Cell Biol 9: 616–627 - PMC - PubMed

Publication types

Substances