. 2011 Aug;462(2):315-30.
doi: 10.1007/s00424-011-0959-9. Epub 2011 May 10.

Anion currents in yeast K+ transporters (TRK) characterize a structural homologue of ligand-gated ion channels

Affiliations

Anion currents in yeast K+ transporters (TRK) characterize a structural homologue of ligand-gated ion channels

Alberto Rivetta et al. Pflugers Arch. 2011 Aug.

Abstract

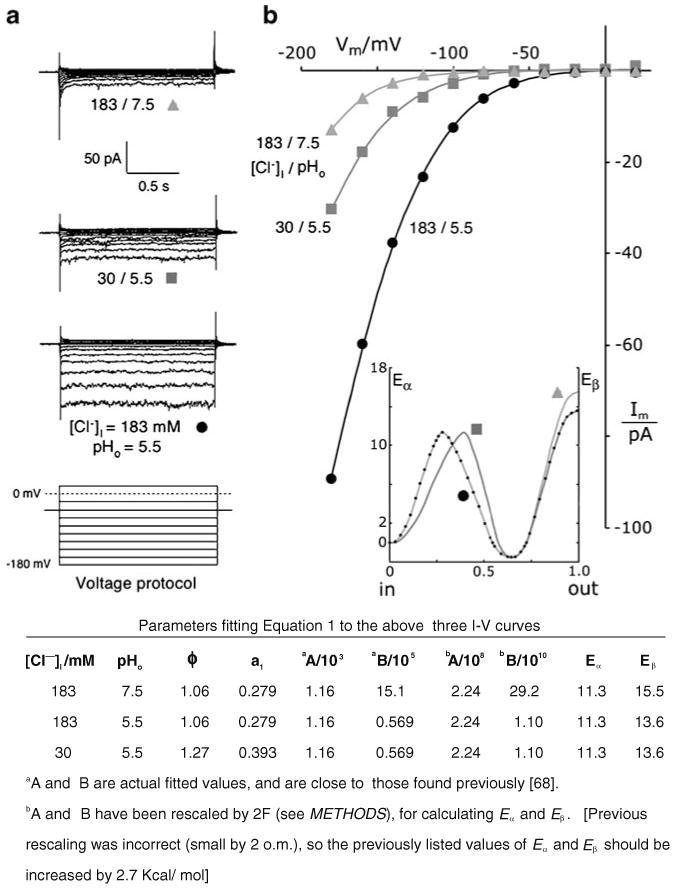
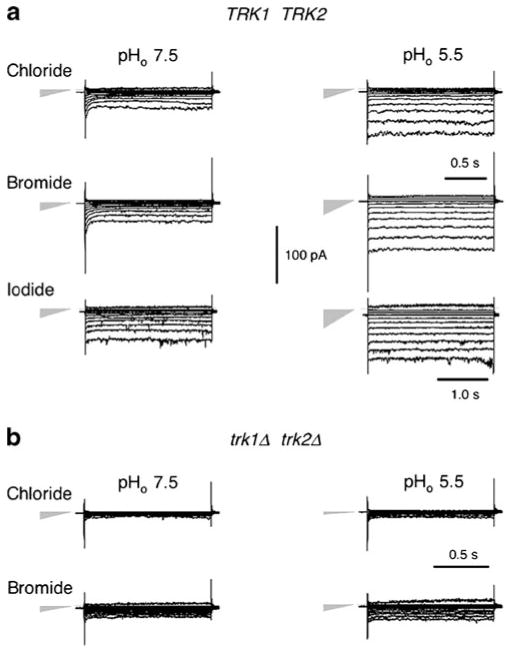
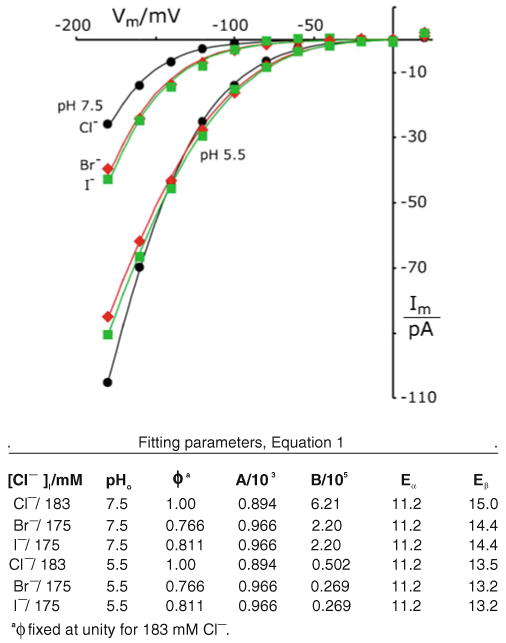
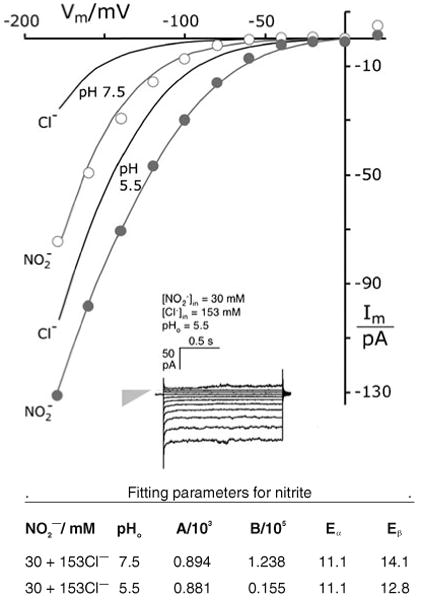
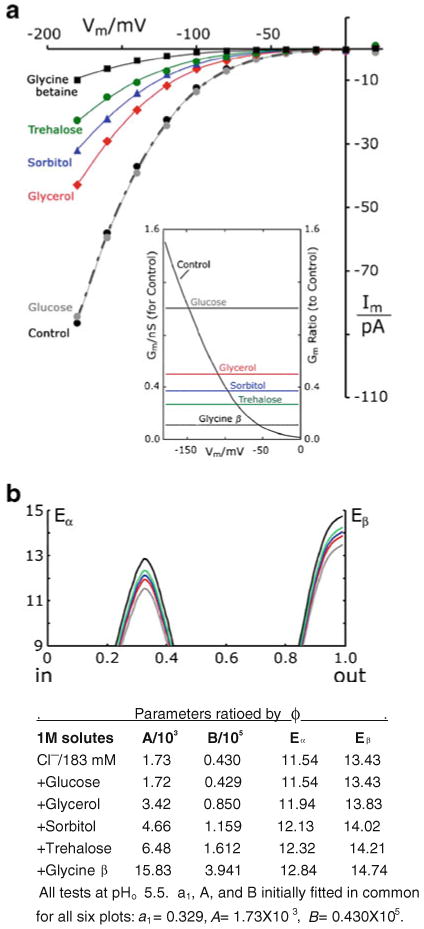
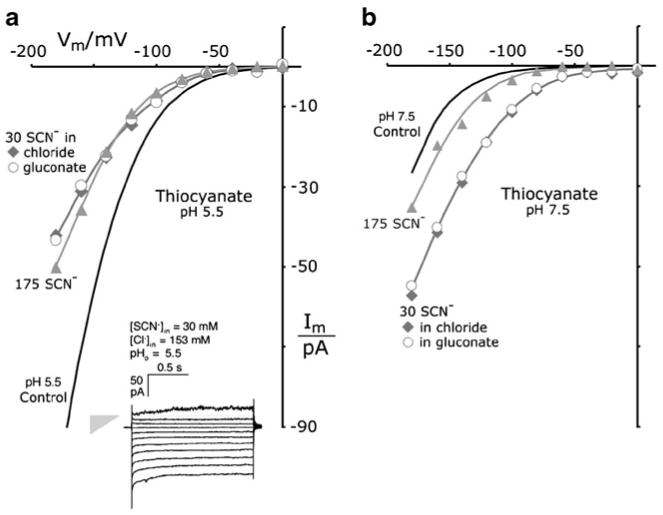
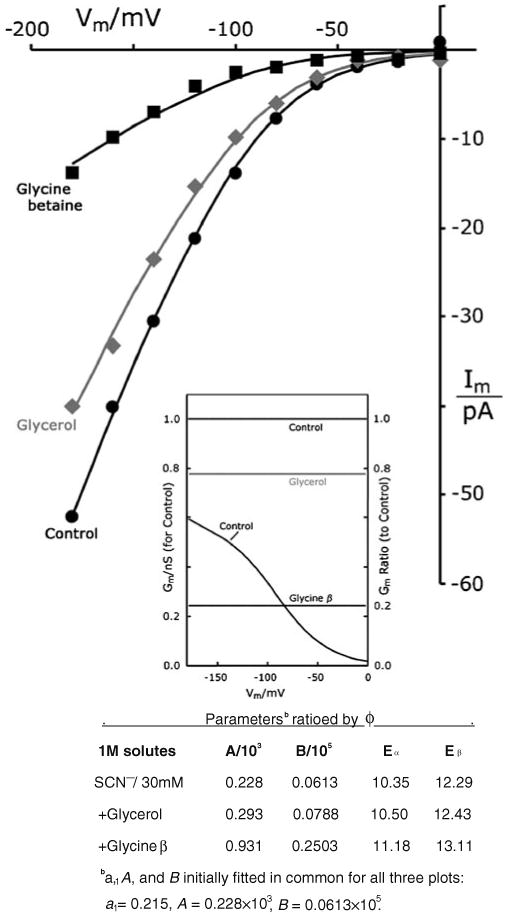
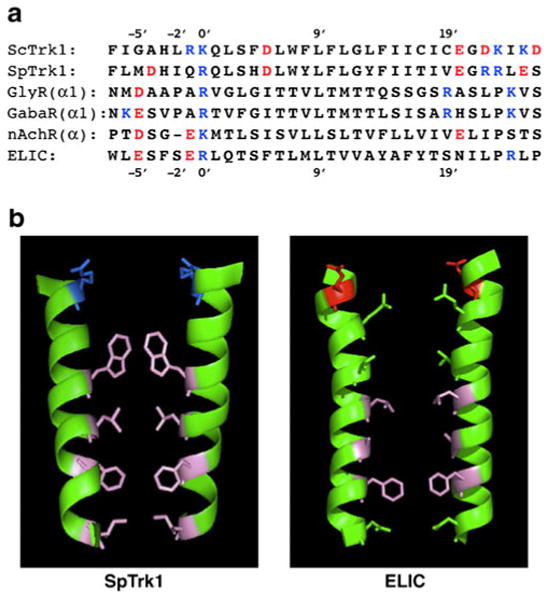
Patch clamp studies of the potassium-transport proteins TRK1,2 in Saccharomyces cerevisiae have revealed large chloride efflux currents: at clamp voltages negative to -100 mV, and intracellular chloride concentrations >10 mM (J. Membr. Biol. 198:177, 2004). Stationary-state current-voltage analysis led to an in-series two-barrier model for chloride activation: the lower barrier (α) being 10-13 kcal/mol located ~30% into the membrane from the cytoplasmic surface; and the higher one (β) being 12-16 kcal/mol located at the outer surface. Measurements carried out with lyotrophic anions and osmoprotective solutes have now demonstrated the following new properties: (1) selectivity for highly permeant anions changes with extracellular pH; at pH(o)= 5.5: I(-)≈ Br(-) >Cl(-) >SCN(-) >NO (3)(-) , and at pH(o) 7.5: I(-)≈ Br(-) > SCN(-) > NO(3)(-) >Cl(-). (2) NO(2)(-) acts like "superchoride", possibly enhancing the channel's intrinsic permeability to Cl(-). (3) SCN(-) and NO(3)(-) block chloride permeability. (4) The order of selectivity for several slightly permeant anions (at pH(o)= 5.5 only) is formate>gluconate>acetate>>phosphate(-1). (5) All anion conductances are modulated (choked) by osmoprotective solutes. (6) The data and descriptive two-barrier model evoke a hypothetical structure (Biophys. J. 77:789, 1999) consisting of an intramembrane homotetramer of fungal TRK molecules, arrayed radially around a central cluster of four single helices (TM7) from each monomer. (7) That tetrameric cluster would resemble the hydrophobic core of (pentameric) ligand-gated ion channels, and would suggest voltage-modulated hydrophobic gating to underlie anion permeation.


Figures

Fig. 1
Fig. 1
Models for TRK structure and for chloride conduction. a Tetramer co-organized by proximation of M1D helices in four separate TRK monomers: cylinder and wire diagrams in green, gray, blue, and red (counterclockwise) depict the backbone structures as originally proposed by Durell and Guy [23]. Cylinders represent TM helices M1D (near center) and M2D, while the other TM helices: M1A−M2A, M1B−M2B, M1C−M2C progress ccw within each monomer. Magenta figures represent the four selectivity sequences comprising the K+ pathway, central to each monomer: a QTGLO, b DLGYS, c SAGFT, and d TVGLS, for Trk1p in Schizosaccharomyces pombe. Central blue ball indicates the proposed pathway for chloride transit through the supertetramer [68]. Coordinate map provided by Dr. HR Guy. Drawing via PyMOL (DeLano Scientific, & Schrödinger LLC, Portland, OR, USA). b Diagram of two energy barriers to chloride transit, in series through the membrane dielectric. Parameters to be fitted, under stationary-state conditions, are a1, b2, A=exp(Eα/RT), and B=exp(Eβ/RT)
Fig. 2
Fig. 2
TRK-mediated, voltage-driven anion effluxes (inward currents) depend strongly on [Cl]i and pHo. a Typical patch clamp traces from a cluster of experiments on wild-type Saccharomyces spheroplasts using a standard voltage-clamp protocol (bottom stack). Reference (holding) voltage at −40 mV; from there, 1.5-s clamp pulses were imposed to +100 mV, +80…0 mV, −20…−160, and −180 mV. Actual data were truncated positive to +20 mV. Measured currents are shown for one cell with standard intracellular chloride (183 mM), at two different extracellular pH values 7.5, 5.5, and for a second cell at pH 5.5, with lowered intracellular chloride 30 mM. As previously observed [68], all current traces settled to stable values in < 200 ms. Extracellular solutions: buffer D (pH 7.5) and buffer 5.5; intracellular solutions: buffer G-Cl and G-30 (see “Methods” section, recording buffers). Data all from strain EBC202. b Current-voltage plots corresponding to the record sets in a obtained by averaging currents sampled between 0.75 and 1.35 s along each trace, then correcting for leakage (see “Methods” section). Smoothed curves through the plotted points were calculated via Eq. 1, which had been fitted simultaneously to all three plots, with a1 forced to its previously determined values [68] and with the number of common parameters maximized. The full set of fitted values is shown in the table below. Inset idealized drawing to illustrate behavior of the two postulated energy barriers controlling chloride permeation. The height of barrier β would decrease with falling pHo; and a1, the peak position of barrier α, would shift deeper into the membrane with falling [Cl]i. b2, the fractional distance from the peak of barrier β to the outer surface of the membrane dielectric, was fixed at zero
Fig. 3
Fig. 3
Raw data traces showing the effects of different halide ions (intracellular) on inward currents through yeast plasma membranes. a Wild-type cells, strain EBC202. b trk1Δ-trk2Δ cells, strain EBK202. Gray triangles on the left designate both the null-current level (point) and the relative leak conductance (height) for each stack. For reference, leak conductance with iodide at pH 5.5 was 290 pS. Note occasional channel-like “switched” noise at the higher voltages, especially with iodide. “Methods” section as for Fig. 2a. Extracellular solutions: buffer D or buffer 5.5; intracellular (pipette) solutions: buffer G-Cl; G-Br, or G-I: 175 mM KBr or 175 mM KBr replacing equivalent KCl from buffer G-Cl
Fig. 4
Fig. 4
The TRK inwardly rectifying pathway is permeable to all three common halides. Plots represent averaged I–V data from all halide records generated as in Fig. 3, for wild-type spheroplasts. Smooth curves calculated with a1=0.279 as previously determined for 183 mM Cl (Fig. 2), and the other parameters fitted simultaneously for all six plots (see Table below). Methods as in Figs. 2 and 3. Yeast strains EBC202 and K837. [To reduce clutter, scatter bars have been omitted from the plots, but SEMs at −180 mV varied in the range 4– 10 pA, and tapered to less than 1.5 pA at −100 mV, i.e., to within the height of the plot symbols]
Fig. 5
Fig. 5
Nitrite ions augment chloride currents through the TRK proteins. Gray plots, curves. Currents measured with 30 mM NO2 replacing equivalent KCl in buffer G-Cl. Equation 1 fitted with ϕ set at unity and a1=0.279; other parameters tabulated below. Black curves Fitted reference current-voltage curves, taken from Fig. 4, for pure chloride. Methods as in Figs. 2 and 3; strain EBC202. Inset Sample current traces in the presence of 30 mM NO2. Gray triangle designates null current (point) and leak conductance (height, 410 pS)
Fig. 6
Fig. 6
Osmoprotective solutes choke halide currents through TRK. a I–V plots with buffer G-Cl supplemented by molar concentrations of five different neutral solutes (pHo 5.5 only). All six plots fit by Eq. 1, with all parameters found in common, except for the scaling factor (ϕ). ϕ optimized at 1.004, 0.506, 0.371, 0.267, and 0.109, respectively, for glucose, glycerol, sorbitol, trehalose, and glycine betaine. Average I–V data for at least three separate trials with each solute. SEMs at −180 mV were six to seven for glucose, glycerol, and sorbitol; three for trehalose; and one for glycine betaine. All cells except controls were grown, protoplasted, and measured in 1 M glycerol. Controls were grown and protoplasted in the usual manner, without glycerol (see “Methods” section). Other methods as in Figs. 2 and 3. Strain EBC202. Inset conductance-voltage curve corresponding to the control I–V curve and scaled on the left ordinate; plus conductance ratios (divided by control), scaled on the right ordinate for the five solutes. Horizontal lines at the original fit-values of ϕ. b Idealized drawings of the energy–barrier curves which result from dividing the peak parameters, a and b, by fitted value of ϕ for each solute. Display truncated below 9 Kcal/mol
Fig. 7
Fig. 7
Thiocyanate supplants chloride currents through the TRK proteins. a Measurements at pHo 5.5. b Measurements at pHo 7.5. I–V plots for averaged data with 175 mM SCN (gray triangles) and with 30 mM SCN (gray diamonds, open circles). Gluconate buffer (intracellular) contained 30 mM KSCN+145 K-gluconate, replacing the 175 mM KCl of buffer G-Cl. Six experiments carried out with SCN+Cl, two with SCN+gluconate. Smooth curves for thiocyanate are all drawn “by eye.” Controls (black curves) are the fitted chloride curves from Fig. 4. Inset Sample current traces in the presence of 30 mM SCN. Gray triangle designates null current (point) and leak conductance (height=448 pS). Methods as in Figs. 2 and 3. Strain EBC 202
Fig. 8
Fig. 8
Osmoprotective solutes choke currents of chaotropic ions. I–V plots with buffer G-SCN supplemented by molar concentrations of glycerol or glycine betaine (pHo 5.5 only). All three plots fit by Eq. 1, with all parameters found in common except f, which optimized at 0.777 for glycerol, and at 0.245 for glycine betaine. Methods as in Figs. 6 and 7. Control data were obtained similarly to those for 30 mM SCN- in chloride (pH 5.5), from Fig. 7. Strain EBC202. Fitted and ratioed parameter values are tabulated below. Inset Conductance– voltage curve corresponding to the control I–V curve (SCN-) and scaled on the left ordinate; plus conductance ratios (divided by control), scaled on the right ordinate. Horizontal lines lie at the original fit values of ϕ. [Concentration terms in the numerator of Eq. 1 were chosen rather arbitrarily; intracellular = 30 mM, on the literal assumption that Cl currents were blocked; and extracellular = 3 mM, to minimize calculated offset currents (see METHODS)]
Fig. 9
Fig. 9
Comparison of yeast transmembrane segments M1D and pore-lining segments (M2, α2) of four ligand-gated ion channels (LGICs). a Primary sequences, in order top to bottom: S. cerevisiae; Schizosaccharomyces pombe, human glycine receptor α1 subunit, GABAA receptor α subunit (highly conserved sequence, identical in many species: human, mouse, rat, chicken, zebrafish, etc.); nicotinic acetylcholine receptor α subunit (also highly conserved: human, etc.); Erwinia chrysanthemi, recently crystallized bacterial homologue of nAchR [11, 36]. Customary numbering convention for LGICs, with 0′ lying at the internal face of the membrane and 20′ at the external face. b Ribbon models of paired transmembrane segments for SpTrk1 (left panel; the sequence directly modeled by Durell and Guy [23]) and for ELIC, spanning from −1′ at the inner surface of the membrane to 20′ at the outer surface. Stick figures depict only those side chains pointing into the channel. Blue basic amino acids, red acidic amino acids, pink hydrophobic amino acids, green uncharged polar amino acids. [The guanidinium side-chain on arginine at 0′ in ELIC projects away from the pore, and therefore is not shown. Bona fide LGIC channels are pentameric; the postulated structure for TRK-Cl channels is tetrameric.] Drawing via PyMOL (DeLano Scientific, & Schrödinger LLC, Portland, OR, USA)

Similar articles

Cited by

References

    1. Arriza JL, Ellasof S, Kavanaugh MP, Amara SG. Excitatory amino acid transporter 5, a retinal glutamate transporter coupled to a chloride conductance. Proc Natl Acad Sci USA. 1997;94:4155–4160. - PMC - PubMed
    1. Back JF, Oakenfull D, Smith MB. Increased thermal stability of proteins in the presence of sugars and polyols. Biochem. 1979;18:5191–5196. - PubMed
    1. Beckstein O, Biggin PC, Sansom MSP. A hydrophobic gating mechanism for nanopores. J Phys Chem B. 2001;105:12902–12905.
    1. Beckstein O, Sansom MSP. Liquid-vapor oscillations of water in hydrophobic nanopores. Proc Nat Acad Sci USA. 2003;100:7063–7068. - PMC - PubMed
    1. Beckstein O, Sansom MSP. A hydrophobic gate in an ion channel: the closed state of nicotinic acetylcholine receptor. Phys Biol. 2006;3:147–159. - PubMed

Publication types

MeSH terms