

Adrenoceptor activity of muscarinic toxins identified from mamba venoms
- PMID: 21557730
- PMCID: PMC3188914
- DOI: 10.1111/j.1476-5381.2011.01468.x
Adrenoceptor activity of muscarinic toxins identified from mamba venoms
Abstract
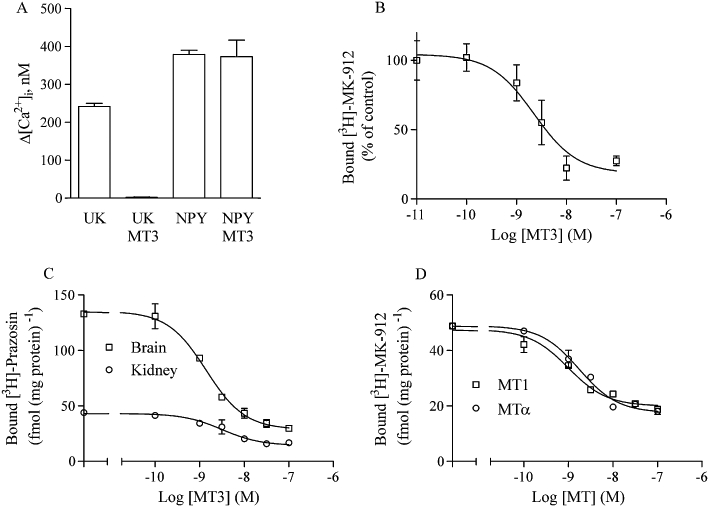
Background and purpose: Muscarinic toxins (MTs) are snake venom peptides named for their ability to interfere with ligand binding to muscarinic acetylcholine receptors (mAChRs). Recent data infer that these toxins may have other G-protein-coupled receptor targets than the mAChRs. The purpose of this study was to systematically investigate the interactions of MTs with the adrenoceptor family members.
Experimental approach: We studied the interaction of four common MTs, MT1, MT3, MT7 and MTα, with cloned receptors expressed in insect cells by radioligand binding. Toxins showing modest to high-affinity interactions with adrenoceptors were additionally tested for effects on functional receptor responses by way of inhibition of agonist-induced Ca²⁺ increases.
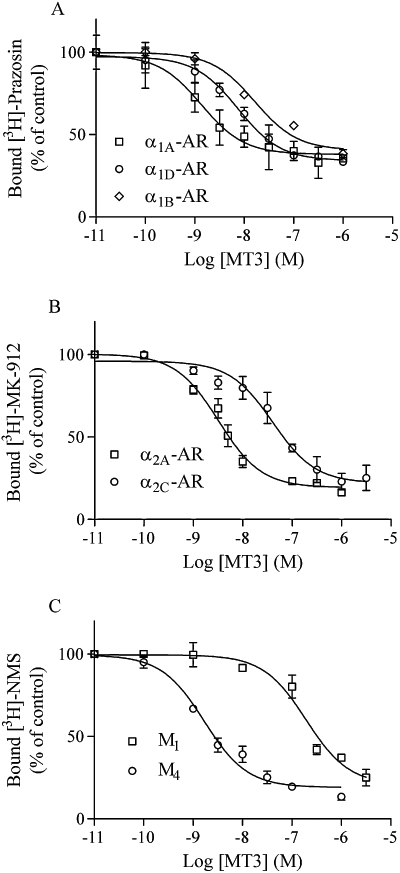
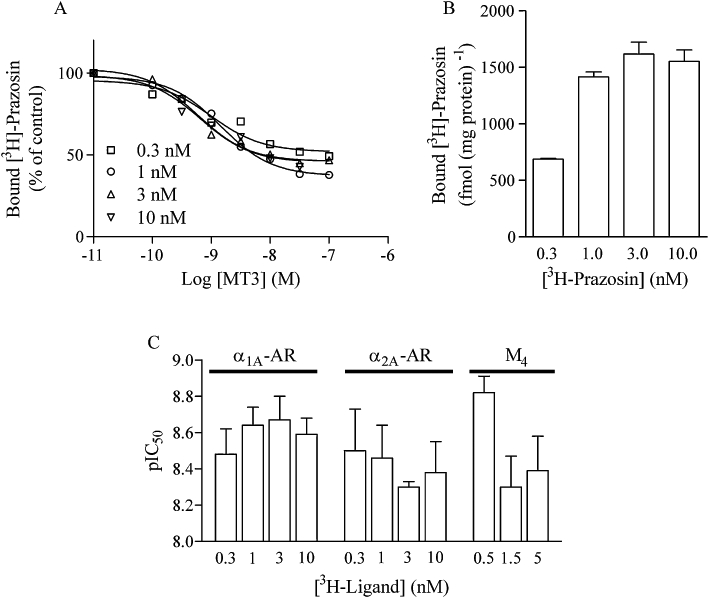
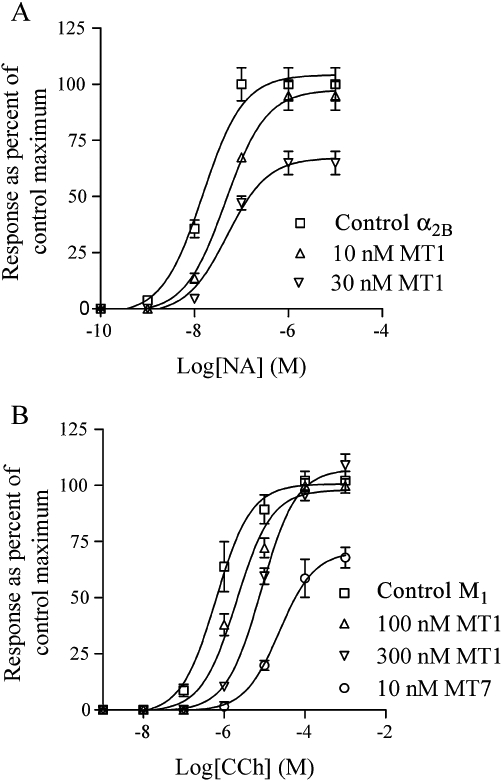
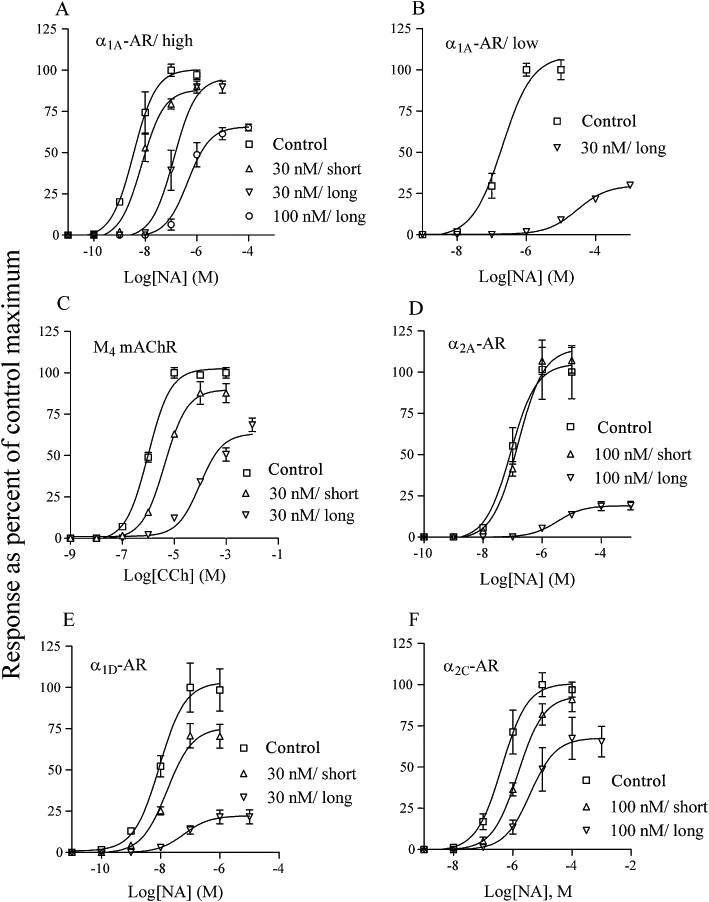
Key results: All MTs behaved non-competitively in radioligand displacement binding. MT1 displayed higher binding affinity for the human α(2B)-adrenoceptor (IC₅₀ = 2.3 nM) as compared with muscarinic receptors (IC₅₀ ≥ 100 nM). MT3 appeared to have a broad spectrum of targets showing high-affinity binding (IC₅₀ = 1-10 nM) to M₄ mAChR, α(1A)-, α(1D)- and α(2A)-adrenoceptors and lower affinity binding (IC₅₀ ≥ 25 nM) to α(1B)- and α(2C)-adrenoceptors and M₁ mAChR. MT7 did not detectably bind to other receptors than M₁, and MTα was specific for the α(2B)-adrenoceptor. None of the toxins showed effects on β₁- or β₂-adrenoceptors.
Conclusions and implications: Some of the MTs previously found to interact predominantly with mAChRs were shown to bind with high affinity to selected adrenoceptor subtypes. This renders these peptide toxins useful for engineering selective ligands to target various adrenoceptors.
© 2011 The Authors. British Journal of Pharmacology © 2011 The British Pharmacological Society.
Figures

Similar articles
-
Effects of muscarinic toxins MT2 and MT7, from green mamba venom, on m1, m3 and m5 muscarinic receptors expressed in Chinese Hamster Ovary cells.Toxicon. 2003 Feb;41(2):207-15. doi: 10.1016/s0041-0101(02)00278-7. Toxicon. 2003. PMID: 12565740
-
The three-finger toxin MTalpha is a selective alpha(2B)-adrenoceptor antagonist.Toxicon. 2010 Sep 1;56(3):440-7. doi: 10.1016/j.toxicon.2010.05.001. Epub 2010 May 11. Toxicon. 2010. PMID: 20466015
-
New α-adrenergic property for synthetic MTβ and CM-3 three-finger fold toxins from black mamba.Toxicon. 2013 Dec 1;75:160-7. doi: 10.1016/j.toxicon.2013.04.017. Epub 2013 May 3. Toxicon. 2013. PMID: 23648423
-
Muscarinic toxins from the green mamba.Pharmacol Ther. 2000 Feb;85(2):87-109. doi: 10.1016/s0163-7258(99)00064-9. Pharmacol Ther. 2000. PMID: 10722122 Review.
-
[Transition of drug receptor mechanisms].J Smooth Muscle Res. 1992 Apr;28(2):35-54. doi: 10.1540/jsmr.28.35. J Smooth Muscle Res. 1992. PMID: 1327301 Review. Japanese.
Cited by
-
Molecular conversion of muscarinic acetylcholine receptor M(5) to muscarinic toxin 7 (MT7)-binding protein.Toxins (Basel). 2011 Nov;3(11):1393-404. doi: 10.3390/toxins3111393. Epub 2011 Nov 11. Toxins (Basel). 2011. PMID: 22174976 Free PMC article.
-
Engineering of three-finger fold toxins creates ligands with original pharmacological profiles for muscarinic and adrenergic receptors.PLoS One. 2012;7(6):e39166. doi: 10.1371/journal.pone.0039166. Epub 2012 Jun 14. PLoS One. 2012. PMID: 22720062 Free PMC article.
-
Intravitreal brimonidine inhibits form-deprivation myopia in guinea pigs.Eye Vis (Lond). 2021 Jul 14;8(1):27. doi: 10.1186/s40662-021-00248-0. Eye Vis (Lond). 2021. PMID: 34256866 Free PMC article.
-
Brimonidine as a possible treatment for myopia.BMC Ophthalmol. 2024 Apr 11;24(1):161. doi: 10.1186/s12886-024-03433-6. BMC Ophthalmol. 2024. PMID: 38605375 Free PMC article.
-
Nature-Derived Peptides: A Growing Niche for GPCR Ligand Discovery.Trends Pharmacol Sci. 2019 May;40(5):309-326. doi: 10.1016/j.tips.2019.03.004. Epub 2019 Apr 5. Trends Pharmacol Sci. 2019. PMID: 30955896 Free PMC article. Review.
References
-
- Adem A, Åsblom A, Johansson G, Mbugua PM, Karlsson E. Toxins from the venom of the green mamba Dendroaspis angusticeps that inhibit the binding of quinuclidinyl benzilate to muscarinic acetylcholine receptors. Biochim Biophys Acta. 1988;968:340–345. - PubMed
-
- Bradley KN. Muscarinic toxins from the green mamba. Pharmacol Ther. 2000;85:87–109. - PubMed
-
- Bradley KN, Rowan EG, Harvey AL. Effects of muscarinic toxins MT2 and MT7, from green mamba venom, on m1, m3 and m5 muscarinic receptors expressed in Chinese Hamster Ovary cells. Toxicon. 2003;41:207–215. - PubMed
Publication types
MeSH terms
Substances
LinkOut - more resources
Full Text Sources
Miscellaneous
