. 2011 Dec;164(7):1829-44.
doi: 10.1111/j.1476-5381.2011.01475.x.

Depletion and recovery of lymphoid subsets following morphine administration

Affiliations

Depletion and recovery of lymphoid subsets following morphine administration

E Y Zhang et al. Br J Pharmacol. 2011 Dec.

Abstract

Background and purpose: Opioid use and abuse has been linked to significant immunosuppression, which has been attributed, in part, to drug-induced depletion of lymphocytes. We sought to define the mechanisms by which lymphocyte populations are depleted and recover following morphine treatment in mice.

Experimental approach: Mice were implanted with morphine pellets and B- and T-cell subsets in the bone marrow, thymus, spleen and lymph nodes were analysed at various time points. We also examined the effects of morphine on T-cell development using an ex vivo assay.

Key results: The lymphocyte populations most susceptible to morphine-induced depletion were the precursor cells undergoing selection. As the lymphocytes recovered, more lymphocyte precursors proliferated than in control mice. In addition, peripheral T-cells displayed evidence that they had undergone homeostatic proliferation during the recovery phase of the experiments.

Conclusions and implications: The recovery of lymphocytes following morphine-induced depletion occurred in the presence of morphine and via increased proliferation of lymphoid precursors and homeostatic proliferation of T-cells.


Figures

Figure 1
Figure 1
Morphine treatment depletes immature B-cells. Mice were treated with morphine (M), morphine and naltrexone (M + N), naltrexone (N) or placebo (P) and analysed 7 days later. (A) Splenocytes were gated on B220+ cells and analysed for IgM and IgD expression. The percentages of B-cells in each gate are shown. (B) B220+IgM+IgD- cells from (A) were analysed for CD21 and CD23 expression. The percentages of gated cells that were T1 (CD21-) and MZ (CD21+) B-cells are shown. (C) B220+IgM+IgD- cells (shaded histogram), B220+IgM+IgD+ cells (grey line), and B220+IgMloIgD+ cells (black line) from (A) were analysed for CD23 expression. (D) The percentages of bone marrow cells that expressed CD34 are shown. (E) Bone marrow cells were analysed for B220 and IgM expression. The percentages of cells in each gate are shown. Data shown represent one mouse from each group.
Figure 2
Figure 2
Recovery of B-cells after morphine treatment is due to proliferation of B-cell precursors. Mice were treated with morphine or placebo for 7, 14 or 21 days. Untreated control mice are shown as a dashed line. (A) The absolute numbers of splenic B-cells are shown. (B) The percentage of splenic B-cells in the S, G2 or M phase of the cell cycle are shown. (C) Bone marrow cells were analysed for B220 and IgM expression and the percentages of cells in each gate are shown. (D) Cells were gated as in (C) and analysed for DNA content. The percentages of cells in each gate that were in the S, G2 or M phase of the cell cycle are shown. *P < 0.05, **P < 0.01, comparing morphine-treated mice and placebo-treated mice.
Figure 3
Figure 3
Morphine treatment does not affect the percentages of T-cells that are naïve, central memory and effector memory cells. Mice were treated with morphine (M), morphine and naltrexone (M + N), naltrexone (N) or placebo (P). Splenocytes were labelled with anti-CD4, anti-CD8, anti-CD44 and anti-CD62L 7 days after pellet implantation. The percentages of CD4+ cells (A) and CD8+ (B) in each gate are shown. Data shown represent one mouse from each group.
Figure 4
Figure 4
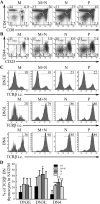
Morphine treatment depletes thymocytes undergoing selection. Mice were treated with morphine (M), morphine and naltrexone (M + N), naltrexone (N) or placebo (P) and analysed 7 days later. Thymocytes were analysed for surface expression of CD4, CD8, CD44 and CD25 and intracellular expression of TCRβ. (A–C) Data shown represent one mouse from each group. (A) The percentages of thymocytes that were DN, DP, SP CD4+ and SP CD8+ cells are shown. (B) Thymocytes were gated on the DN population and analysed for CD44 and CD25 expression. The percentages of DN cells that were DN1, DN2, DN3E, DN3L and DN4 are shown. (C) Thymocytes were gated on DN3E, DN3L and DN4 thymocytes and analysed for intracellular TCRβ expression. The percentages of DN3E, DN3L and DN4 thymocytes that expressed TCRβ are shown. (D) TCRβ+ DN3E, TCRβ+ DN3L and TCRβ+ DN4 thymocytes were analysed for their cell cycle status. The percentages of cells that were in the S, G2 or M phase of the cell cycle are shown. *P < 0.05, **P < 0.01, significantly different from morphine-treated mice.
Figure 5
Figure 5
Morphine treatment induces depletion of ISP CD8+ and TSP CD4+ thymocytes. Mice were treated with morphine (M), morphine and naltrexone (M + N), naltrexone (N) or placebo (P) and analysed 7 days later. Thymocytes were surface labelled with anti-CD4, anti-CD8, anti-CD24 and anti-TCRβ. Cells were gated on SP CD8+ (A) or SP CD4+ (B) thymocytes and analysed for CD24 and TCRβ expression. The percentages of SP CD8+ or SP CD4+ thymocytes in each gate are shown. Data shown represent one mouse from each group.
Figure 6
Figure 6
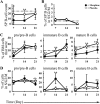
Peripheral T-cells recover from morphine-induced depletion via homeostatic proliferation. Mice were treated with morphine or placebo for 7, 14 or 21 days. Untreated control mice are shown as a dashed line. (A) The absolute number of splenic (SP) and lymph node (LN) T-cells are shown. (B) The percentages of SP and LN CD4+ and CD8+ cells that were in the S, G2 or M phase of the cell cycle are shown. (C) Spleen and lymph node cells were analysed as described in the legend to Figure 3. The percentages of cells that were central memory or effector memory are shown. *P < 0.05, **P < 0.01.
Figure 7
Figure 7
Recovery of T-cells via increased proliferation of precursor cells. Mice were treated with morphine or placebo for 7, 14 or 21 days. Untreated control mice are shown as a dashed line. Thymocytes were analysed as described in Figures 4 and 5. (A) The absolute number of thymocytes is shown. (B) The percentages of thymocytes that were DN, DP, SP CD4+ and SP CD8+ thymocytes and shown. (C) The percentages of DN thymocytes that were DN1, DN2, DN3E, DN3L and DN4 thymocytes are shown. (D) The percentages of SP CD8+ and SP CD4+ thymocytes that were ISP CD8+ and TSP CD4+ thymocytes, respectively, are shown. (E) The percentages of DN3E, DN3L and DN4 thymocytes that expressed TCRβ are shown. (F) The percentages of DN1, DN2, TCRβ+ DN3E and DP thymocytes that were in the S, G2 or M phase of the cell cycle are shown. *P < 0.05, **P < 0.01.
Figure 8
Figure 8
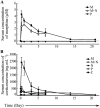
Morphine pellet implantation leads to sustained serum morphine levels and a transient increase in serum corticosterone levels. Mice were implanted with pellets containing morphine (M), morphine and naltrexone (M + N), naltrexone (N), or placebo (P) and blood was collected at the indicated time points. The concentrations of morphine (A) and corticosterone (B) in sera of mice treated for the indicated lengths of time are shown. Untreated control mice (C) were also analysed (B).
Figure 9
Figure 9
Morphine does not directly impair thymic development. FTOC was performed as described in Methods in the presence of 6 µM [M(H)] or 1 µM [M(L)] morphine, 6 µM morphine plus 6 µM naltrexone (M + N), 1 µM dexamethasone (D), or media (C). (A) The absolute numbers of thymocytes recovered after 7 days of culture are shown. (B) Thymocytes were analysed for CD4 and CD8 expression. The percentages of cells that were DN, DP, SP CD4+ and SP CD8+ thymocytes are shown. Dot plots represent one mouse from each group.

Comment in

Similar articles

Cited by

References

    1. Aderjan R, Hofmann S, Schmitt G, Skopp G. Morphine and morphine glucuronides in serum of heroin consumers and in heroin-related deaths determined by HPLC with native fluorescence detection. J Anal Toxicol. 1995;19:163–168. - PubMed
    1. Arora PK, Fride E, Petitto J, Waggie K, Skolnick P. Morphine-induced immune alterations in vivo. Cell Immunol. 1990;126:343–353. - PubMed
    1. Askenasy EM, Askenasy N, Askenasy JJ. Does lymphopenia preclude restoration of immune homeostasis? The particular case of type 1 diabetes. Autoimmun Rev. 2010;9:687–690. - PubMed
    1. Ayala A, Herdon CD, Lehman DL, DeMaso CM, Ayala CA, Chaudry IH. The induction of accelerated thymic programmed cell death during polymicrobial sepsis: control by corticosteroids but not tumor necrosis factor. Shock. 1995;3:259–267. - PubMed
    1. Bach JF, Duval D, Dardenne M, Salomon JC, Tursz T, Fournier C. The effects of steroids on T-cells. Transplant Proc. 1975;7:25–30. - PubMed

Publication types

MeSH terms