. 2011 Aug;10(8):M110.006411.
doi: 10.1074/mcp.M110.006411. Epub 2011 May 10.

Quantitative time-course profiling of parasite and host cell proteins in the human malaria parasite Plasmodium falciparum

Affiliations

Quantitative time-course profiling of parasite and host cell proteins in the human malaria parasite Plasmodium falciparum

Bernardo Javier Foth et al. Mol Cell Proteomics. 2011 Aug.

Abstract

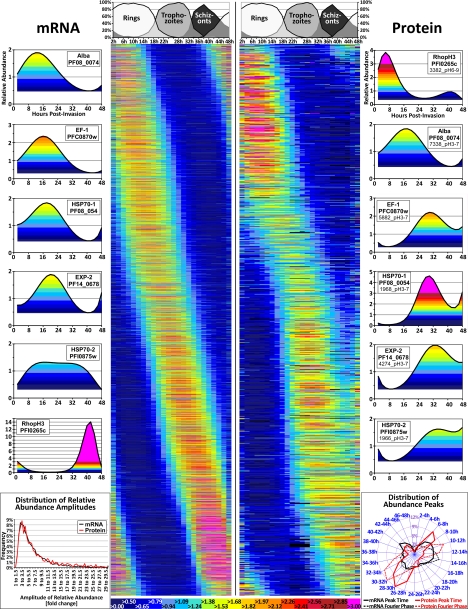
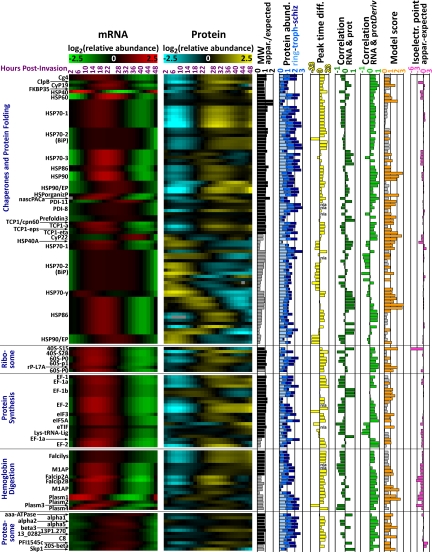
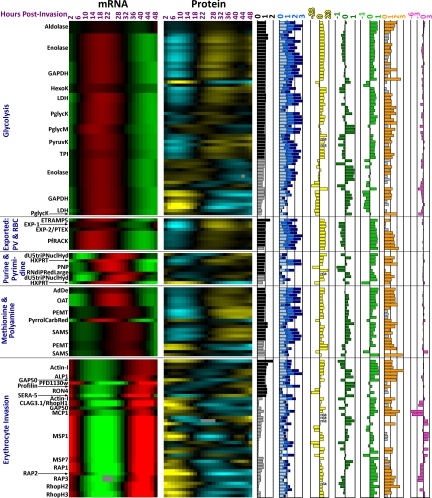
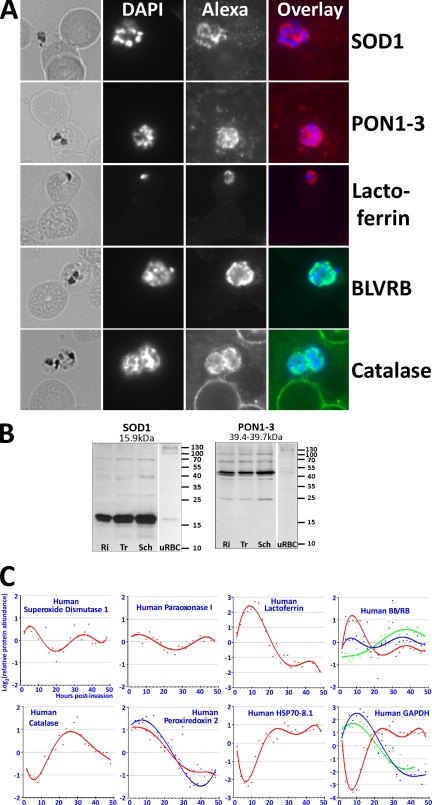
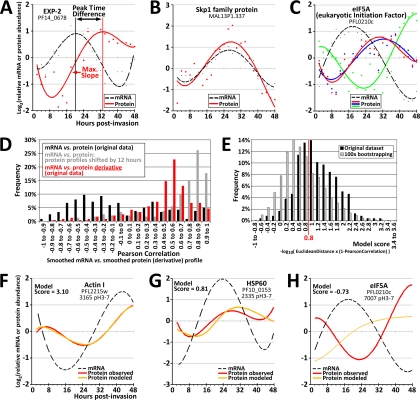
Studies of the Plasmodium falciparum transcriptome have shown that the tightly controlled progression of the parasite through the intra-erythrocytic developmental cycle (IDC) is accompanied by a continuous gene expression cascade in which most expressed genes exhibit a single transcriptional peak. Because the biochemical and cellular functions of most genes are mediated by the encoded proteins, understanding the relationship between mRNA and protein levels is crucial for inferring biological activity from transcriptional gene expression data. Although studies on other organisms show that <50% of protein abundance variation may be attributable to corresponding mRNA levels, the situation in Plasmodium is further complicated by the dynamic nature of the cyclic gene expression cascade. In this study, we simultaneously determined mRNA and protein abundance profiles for P. falciparum parasites during the IDC at 2-hour resolution based on oligonucleotide microarrays and two-dimensional differential gel electrophoresis protein gels. We find that most proteins are represented by more than one isoform, presumably because of post-translational modifications. Like transcripts, most proteins exhibit cyclic abundance profiles with one peak during the IDC, whereas the presence of functionally related proteins is highly correlated. In contrast, the abundance of most parasite proteins peaks significantly later (median 11 h) than the corresponding transcripts and often decreases slowly in the second half of the IDC. Computational modeling indicates that the considerable and varied incongruence between transcript and protein abundance may largely be caused by the dynamics of translation and protein degradation. Furthermore, we present cyclic abundance profiles also for parasite-associated human proteins and confirm the presence of five human proteins with a potential role in antioxidant defense within the parasites. Together, our data provide fundamental insights into transcript-protein relationships in P. falciparum that are important for the correct interpretation of transcriptional data and that may facilitate the improvement and development of malaria diagnostics and drug therapy.


Figures

Fig. 1.
Fig. 1.
Overview of the transcript and protein abundance profiles. The left half of the central main figure depicts 4,670 transcript abundance profiles whereas the right half shows 1183 protein abundance profiles. In these central panels each line represents one distinct gene (for the transcripts) on the left or one protein isoform on the right, whereas the 24 columns indicate the time point (in hpi = hours postinvasion) of the sample. Importantly, in this figure the lines representing transcripts (on the left) and proteins (on the right) do not correspond to one another, and the abundance profiles were sorted according to their Fourier phase. The profiles shown derive from log2-transformed and mean-centered quantitative data that were polynomial-fitted and then converted back to a nonlogarithmic scale. The color scale indicating relative transcript or protein abundance is provided at the bottom of the figure, whereas the progression of the parasite population through the IDC is indicated at the top. Six examples of transcript abundance profiles and selected corresponding protein abundance profiles are shown at the sides. Lower left panel: the distribution of relative abundance amplitudes. Lower right panel: the distribution over time of abundance peaks as calculated by Fourier transformation and as evidenced by the major peak of the polynomial fit.
Fig. 2.
Fig. 2.
Expression and other data arranged by major groups of protein function as indicated on the left. The two main columns titled “mRNA” and “Protein” show log2-transformed relative transcript and protein abundance based on oligonucleotide microarray and 2D-DIGE data. Within each of the functional groups the protein isoforms are subsequently sorted according to their molecular weight as apparent by 2D-gel electrophoresis, which is presented as a ratio of apparent/expected molecular weight (column “MW”). Black and gray bars indicate “full-length” and “truncated” protein isoforms, respectively (see Experimental Procedures). An estimation of absolute protein abundance for each protein isoform observed on the two-dimensional gels has been carried out independently for ring-, trophozoite-, and schizont-stage parasites (column “Protein abund.”). The correlation between each pair of transcript and corresponding protein abundance profiles is indicated by their respective peak time difference (i.e. the difference of the peak time of the protein profile minus the peak time of the transcript profile; column “Peak time diff.”), their respective Pearson correlation coefficient (column “Correlation RNA and prot”), and the Pearson correlation coefficient of the transcript abundance profile and the mathematical derivative of the corresponding protein abundance profile (column “Correlation RNA and protDeriv”). The best modeling score (see main text and Experimental Procedures) is shown with scores greater than the high-quality cutoff score of 0.8 highlighted in orange (column “Model score”). The difference between the expected and the apparent (as estimated from the two-dimensional gels) isoelectric point of each protein isoform is depicted in the last column. For abbreviations of protein names please refer to supplemental Table S2.
Fig. 2.
Fig. 2.
Expression and other data arranged by major groups of protein function as indicated on the left. The two main columns titled “mRNA” and “Protein” show log2-transformed relative transcript and protein abundance based on oligonucleotide microarray and 2D-DIGE data. Within each of the functional groups the protein isoforms are subsequently sorted according to their molecular weight as apparent by 2D-gel electrophoresis, which is presented as a ratio of apparent/expected molecular weight (column “MW”). Black and gray bars indicate “full-length” and “truncated” protein isoforms, respectively (see Experimental Procedures). An estimation of absolute protein abundance for each protein isoform observed on the two-dimensional gels has been carried out independently for ring-, trophozoite-, and schizont-stage parasites (column “Protein abund.”). The correlation between each pair of transcript and corresponding protein abundance profiles is indicated by their respective peak time difference (i.e. the difference of the peak time of the protein profile minus the peak time of the transcript profile; column “Peak time diff.”), their respective Pearson correlation coefficient (column “Correlation RNA and prot”), and the Pearson correlation coefficient of the transcript abundance profile and the mathematical derivative of the corresponding protein abundance profile (column “Correlation RNA and protDeriv”). The best modeling score (see main text and Experimental Procedures) is shown with scores greater than the high-quality cutoff score of 0.8 highlighted in orange (column “Model score”). The difference between the expected and the apparent (as estimated from the two-dimensional gels) isoelectric point of each protein isoform is depicted in the last column. For abbreviations of protein names please refer to supplemental Table S2.
Fig. 3.
Fig. 3.
Human proteins. Immunofluorescence microscopy confirmed the presence of five human proteins (A, Alexa channel) within intraerythrocytic P. falciparum parasites. It is noteworthy that these proteins are so abundant in the parasites that they are in most cases almost invisible in the surrounding erythrocytes at the aperture settings and exposure times chosen to take these images. In the overlay panels DAPI staining is indicated in blue while the Alexa signal is shown in red or green. Western blots (B) confirm the presence of full-length SOD1 and paraoxonase in the parasites (Ri, rings; Tr, trophozoites; Sch, schizonts; uRBC, uninfected red blood cells; a total of 30 μg protein was loaded in each lane, all lanes containing SDS protein lysates of the pellet fraction after saponin lysis of the red blood cells). In contrast, the antibodies yielded significantly weaker signals on the same amount of protein (30 μg per lane) extracted from the pellet fraction of saponin-lysed uninfected erythrocytes (uRBC). The latter was chosen as a control protein preparation because it contains those erythrocyte proteins that are most likely to constitute “contaminating” human proteins expected to also be present in the parasite protein preparations without necessarily being localized within the parasites or parasite-derived structures such as Maurer's clefts. The relative abundance profiles of a selection of human proteins are depicted in panel C. All abundance profiles can be found in supplemental Fig. S4.
Fig. 4.
Fig. 4.
Transcript and protein abundance tk;4profiles, transcript-protein correlations, and mathematical modeling. A–C show log2-transformed polynomial-fitted (“smoothed”) abundance profiles for individual proteins. The dots indicate the averaged raw data values while the lines represent polynomial curves fitted through the data. D, The distribution of Pearson correlation coefficients in pairwise comparisons of protein profiles and their corresponding transcript abundance profiles. The black bars represent the Pearson correlation coefficients as calculated from the original transcript and protein abundance data. The gray bars indicate the pairwise Pearson correlations when all protein profiles are shifted ahead-in-time (to the left along the time-axis) by 12 h. The red bars represent the Pearson correlations of the transcript abundance profiles versus the derivative of the protein abundance profiles. Similar results were obtained (data not shown) when transcript abundance was compared with profiles of a combined measure of protein abundance from all identified isoforms of a given protein (see Experimental Procedures and the panels “Combined Protein Data” in supplemental Fig. S4). E, A simple mathematical algorithm was employed to test whether the observed protein abundance profiles could be modeled from the observed mRNA abundance data (see main text and Experimental Procedures for further details). The graph shows the distribution of model scores for all 237 full-length protein isoforms in comparison to a bootstrap experiment (see text). F–H show three examples of modeled protein abundance profiles, i.e. the graphs for the best (F), an intermediate (G), and the worst fit of modeled to observed protein profiles. Graphs of the modeled protein profiles for all 237 protein isoforms included in these analyses are presented in supplemental Fig. S6.

References

    1. WHO (2009) World Health Organization, Geneva, World Malaria Report 2009
    1. Bozdech Z., Llinás M., Pulliam B. L., Wong E. D., Zhu J., DeRisi J. L. (2003) The transcriptome of the intraerythrocytic developmental cycle of Plasmodium falciparum. PLoS Biol. 1, E5. - PMC - PubMed
    1. Bozdech Z., Mok S., Hu G., Imwong M., Jaidee A., Russell B., Ginsburg H., Nosten F., Day N. P., White N. J., Carlton J. M., Preiser P. R. (2008) The transcriptome of Plasmodium vivax reveals divergence and diversity of transcriptional regulation in malaria parasites. Proc. Natl. Acad. Sci. U.S.A. 105, 16290–16295 - PMC - PubMed
    1. Bozdech Z., Zhu J., Joachimiak M. P., Cohen F. E., Pulliam B., DeRisi J. L. (2003) Expression profiling of the schizont and trophozoite stages of Plasmodium falciparum with a long-oligonucleotide microarray. Genome Biol. 4, R9. - PMC - PubMed
    1. Le Roch K. G., Zhou Y., Blair P. L., Grainger M., Moch J. K., Haynes J. D., De La Vega P., Holder A. A., Batalov S., Carucci D. J., Winzeler E. A. (2003) Discovery of gene function by expression profiling of the malaria parasite life cycle. Science 301, 1503–1508 - PubMed

Publication types

MeSH terms