. 2011 Aug;31(8):1788-98.
doi: 10.1038/jcbfm.2011.67. Epub 2011 May 11.

Stroke penumbra defined by an MRI-based oxygen challenge technique: 2. Validation based on the consequences of reperfusion

Affiliations

Stroke penumbra defined by an MRI-based oxygen challenge technique: 2. Validation based on the consequences of reperfusion

Craig A Robertson et al. J Cereb Blood Flow Metab. 2011 Aug.

Abstract

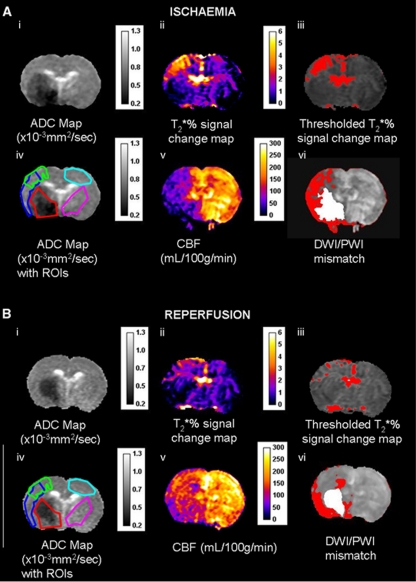
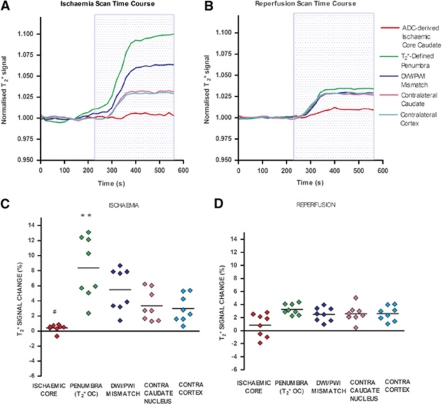
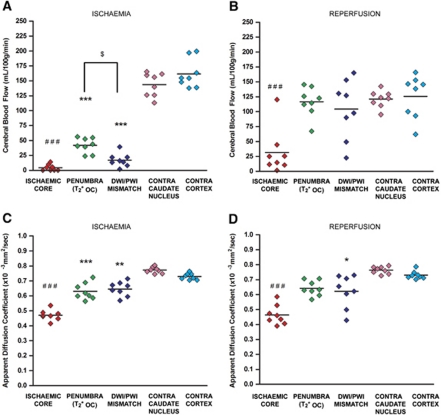
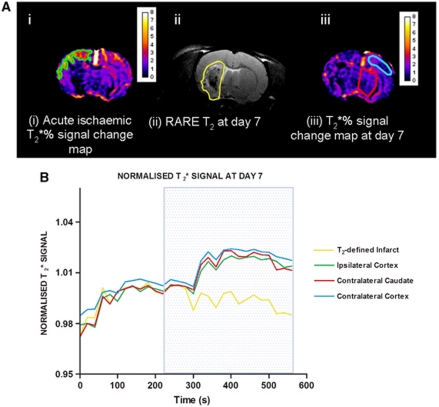
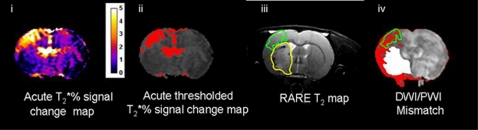
Magnetic resonance imaging (MRI) with oxygen challenge (T(2)(*) OC) uses oxygen as a metabolic biotracer to define penumbral tissue based on CMRO(2) and oxygen extraction fraction. Penumbra displays a greater T(2)(*) signal change during OC than surrounding tissue. Since timely restoration of cerebral blood flow (CBF) should salvage penumbra, T(2)(*) OC was tested by examining the consequences of reperfusion on T(2)(*) OC-defined penumbra. Transient ischemia (109 ± 20 minutes) was induced in male Sprague-Dawley rats (n=8). Penumbra was identified on T(2)(*)-weighted MRI during OC. Ischemia and ischemic injury were identified on CBF and apparent diffusion coefficient maps, respectively. Reperfusion was induced and scans repeated. T(2) for final infarct and T(2)(*) OC were run on day 7. T(2)(*) signal increase to OC was 3.4% in contralateral cortex and caudate nucleus and was unaffected by reperfusion. In OC-defined penumbra, T(2)(*) signal increased by 8.4% ± 4.1% during ischemia and returned to 3.25% ± 0.8% following reperfusion. Ischemic core T(2)(*) signal increase was 0.39% ± 0.47% during ischemia and 0.84% ± 1.8% on reperfusion. Penumbral CBF increased from 41.94 ± 13 to 116.5 ± 25 mL per 100 g per minute on reperfusion. On day 7, OC-defined penumbra gave a normal OC response and was located outside the infarct. T(2)(*) OC-defined penumbra recovered when CBF was restored, providing further validation of the utility of T(2)(*) OC for acute stroke management.


Figures

Figure 1
Figure 1
(A) Ischemia scan series and (B) post-reperfusion scan series, with regions of interest (ROIs) superimposed on the apparent diffusion coefficient (ADC) maps (images Aiv and Biv); (ii) T2* oxygen challenge (OC) percentage signal change map, (iii) thresholded T2* OC map, (v) cerebral blood flow (CBF) map (mL per 100 g per minute), and (vi) DWI/PWI overlay (mismatch tissue shown in red). ROIs were defined as follows: green ROI—the penumbra was defined by applying a threshold to display the greatest T2* percentage signal change excluding veins and ventricles (iii). Red ROI—ischemic core within the caudate nucleus, derived from the ADC lesion (i). Sky blue ROI—the contralateral cortex, equivalent to OC-defined penumbra. Cerise ROI—the contralateral caudate nucleus, equivalent to the ADC-derived lesion. Dark blue ROI— DWI/PWI mismatch (vi) derived from the thresholded ADC (i) and CBF maps (v).
Figure 2
Figure 2
Echo planar imaging (EPI) T2* signal time course during ischemia (A), and following reperfusion (B), mean T2* percentage signal change from baseline for regions of interest (ROIs) during ischemia (C) and following reperfusion (D). (A, B) Positive T2* signal changes were recorded during oxygen challenge (OC) in contralateral caudate nucleus and cortex, the DWI/PWI mismatch, and the T2* OC-defined penumbra. All data were normalized to the average signal over the 4 minutes before OC from eight animals. The blue box represents the period of 100% oxygen inhalation (OC). (C, D) Horizontal lines represent means. **P<0.01, relative to contralateral cortex ROI. #P<0.05, relative to contralateral caudate nucleus.
Figure 3
Figure 3
Mean cerebral blood flow (CBF) and apparent diffusion coefficient (ADC) in selected regions of interest (ROIs) during ischemia and following reperfusion. (A, B) Mean CBF during ischemia and following reperfusion. (C, D) Mean ADC during ischemia and following reperfusion, respectively. Horizontal lines represent means. ***P<0.001, **P<0.01 relative to contralateral cortex ROI. ###P<0.001, ##P<0.01, relative to contralateral caudate nucleus ROI. $P<0.05.
Figure 4
Figure 4
T2* percentage signal change at day 1 and day 7 in selected regions of interest (ROIs). (A) MRI ROIs derived from (i) acute T2* percentage signal change maps during ischemia (ipsilateral cortex penumbra—green); (ii) RARE T2 scans at day 7 after stroke (infarct ROI-yellow); and (iii) T2* percentage signal change maps at day 7 (contralateral cortex and caudate—sky blue and red, respectively). ROIs were superimposed onto day 7 T2* percentage signal change maps generated 7 days after stroke to generate EPI T2* signal time course graphs (B). Traces represent the mean normalized signal from four animals. All data were normalized to the average signal over the 4 minutes before oxygen challenge. Blue box represents period of 100% oxygen inhalation.
Figure 5
Figure 5
Comparison of neuroanatomical location of thresholded oxygen challenge (OC)-defined penumbra in relation to T2-defined final infarct and DWI/PWI mismatch. Acute T2* percentage signal change map (i) was thresholded to identify penumbra (ii) and superimposed upon the day 7 RARE T2 (iii)—penumbra outlined in green. The final infarct is outlined in yellow. The T2* OC penumbra region of interest (ROI) was superimposed upon the DWI/PWI mismatch (iv) to compare the difference in the spatial locations of the mismatch and the T2* OC defined penumbra.

References

    1. Baron JC, Bousser MG, Comar D, Soussaline F, Castaigne R. Noninvasive tomographic study of cerebral blood flow and oxygen metabolism in vivo: potentials, limitations and clinical applications in cerebral ischemic disorders. Eur Neurol. 1981;20:273–284. - PubMed
    1. Bergstedt K, Hu BR, Wieloch T. Postischemic changes in protein synthesis in the rat brain: effects of hypothermia. Exp Brain Res. 1993;95:91–99. - PubMed
    1. Butcher KS, Parsons M, MacGregor L, Barber PA, Chalk J, Bladin C, Levi C, Kimber T, Schultz D, Fink J, Tress B, Donnan G, Davis S. Refinig the perfusion–diffusion mismatch hypothesis. Stroke. 2005;36:1153–1159. - PubMed
    1. Cocho D, Belvis R, Marti-Fabregas J, Molina-Porcel L, Diaz-Manera J, Aleu A, Pagonabarraga J, Garcia-Bargo D, Mauri A, Marti-Vilalta JL. Reasons for exclusion from thrombolytic therapy following acute ischemic stroke. Neurology. 2005;64:719–720. - PubMed
    1. Dani KA, Santosh C, Brennan D, McCabe C, Holmes WM, Condon B, Hadley DM, Macrae IM, Shaw M, Muir KW. T2* weighted magnetic resonance imaging with hyperoxia in acute ischemic stoke. Ann Neurol. 2010;68:37–47. - PubMed

Publication types