. 2011 Apr 25:5:5.
doi: 10.3389/fncir.2011.00005. eCollection 2011.

Lateral Connectivity in the Olfactory Bulb is Sparse and Segregated

Affiliations

Lateral Connectivity in the Olfactory Bulb is Sparse and Segregated

David H Kim et al. Front Neural Circuits. .

Abstract

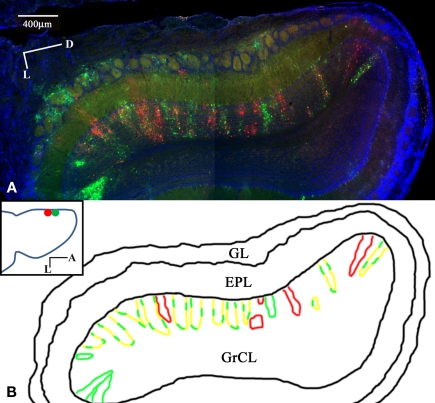
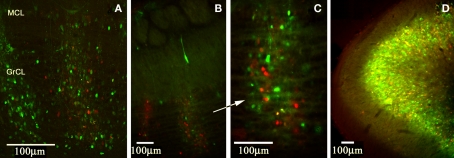
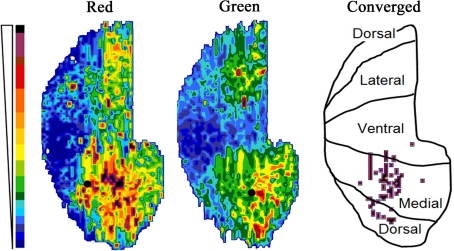
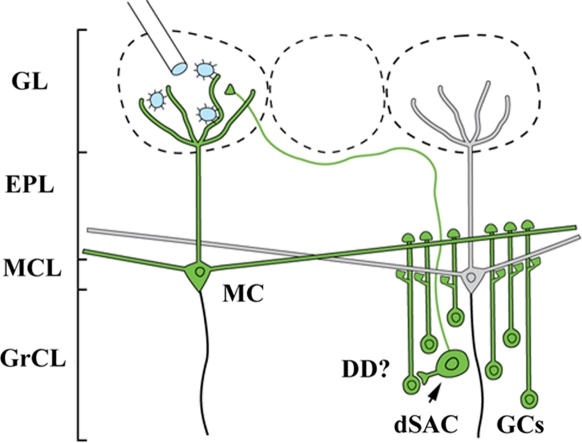
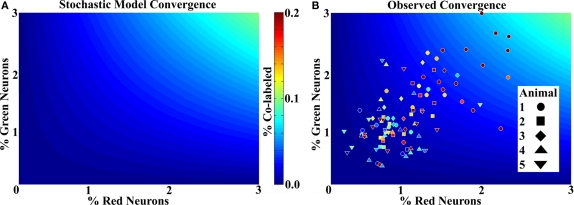
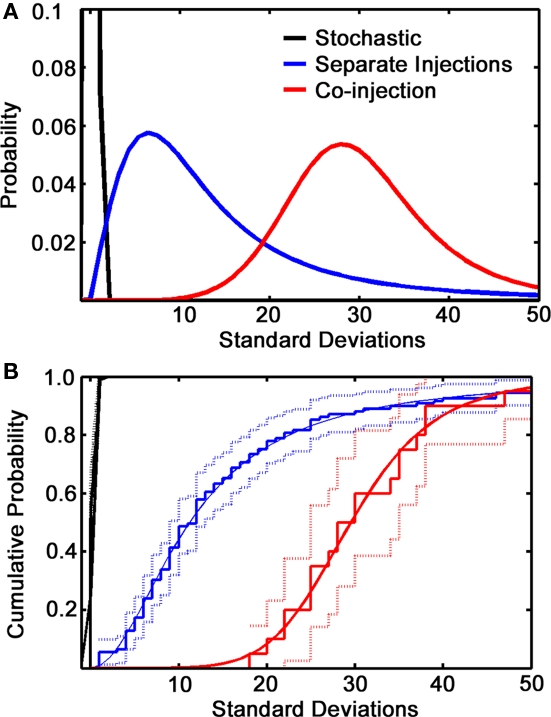
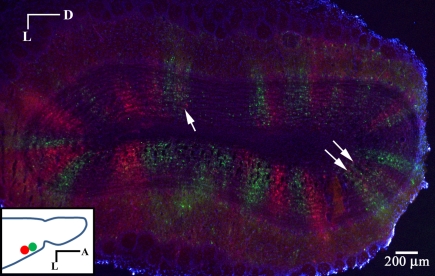
Lateral connections in the olfactory bulb were previously thought to be organized for center-surround inhibition. However, recent anatomical and physiological studies showed sparse and distributed interactions of inhibitory granule cells (GCs) which tended to be organized in columnar clusters. Little is known about how these distributed clusters are interconnected. In this study, we use transsynaptic tracing viruses bearing green or red fluorescent proteins to further elucidate mitral- and tufted-to-GC connectivity. Separate sites in the glomerular layer were injected with each virus. Columns with labeling from both viruses after transsynaptic spread show sparse red or green GCs which tended to be segregated. However, there was a higher incidence of co-labeled cells than chance would predict. Similar segregation of labeling is observed from dual injections into olfactory cortex. Collectively, these results suggest that neighboring mitral and tufted cells receive inhibitory inputs from segregated subsets of GCs, enabling inhibition of a center by specific and discontinuous lateral elements.

Keywords: circuits; connectivity; lateral inhibition; olfaction; olfactory bulb.


Figures

Figure 1
Figure 1
Sparse, segregated labeling in GrCL columns after dual glomerular layer injection. Coronal section of the rat OB and piriform cortex 3 days after Dual PRV injection into the medial glomerular layer (GL). PRV-152 (green) was injected ~500 μm posterior to PRV-614 (red), DAPI (blue). (A) OB section montage. Heterogeneous labeling shows some columns of only one color and varying degrees of columns with interdigitated red and green GCs. (B) Schematic showing columns with single or dual labeling. No columns were observed that contained only co-labeled cells. (Inset) Horizontal schematic showing the injection sites. M/T cells not associated with GC columns are interpreted to arise from third-order labeling via second-order GCs. Labeling is mostly restricted to the injected half of the bulb. Note the few labeled GL cells, showing that PRV can infect these cell types, but labeling is not widespread in the GL.
Figure 2
Figure 2
(A) Confocal image stack of a column with interdigitated labeling. (B,C) A view of a column with interdigitated labeling at 200× and the same column at 400× magnification imaged with mercury lamp excitation to avoid differential bleaching of the fluorophores with laser excitation (maximum intensity plots of 20 image z-stacks). (D) Anterior piriform cortex from the same animal is highly co-labeled in pyramidal cells, suggesting less co-labeling in the GCs is not the result of a viral property.
Figure 3
Figure 3
Map of the fluorescent intensity in the GrCL just deep to the internal plexiform layer (for an explanation of the mapping technique, see Xu et al., 2003). Intensity scale at left. Filled circles show the position of the injection sites in the displayed animal, while the schematic shows the anatomical positions of the rolled out map. Marks on the schematic indicate areas on the medial side where there are strongly converged columns (arbitrary threshold).
Figure 4
Figure 4
Lateral retrograde connections from the OB glomerular layer (GL) to the granule cell layer (GrCL). Because GCs have no axons, a GL injection of Bartha-PRV (which is missing several gene products necessary for anterograde transport) has only two known routes to infect them: lateral dendrites of MT cells and a recently identified sub-population of deep short axon cell (dSAC) which sends axons into the GL. For the infection to pass through the dSAC route, dendrodendritic synapses (DD) must be present, an assumption for which data is lacking. This and the absence of widespread dSAC labeling at early time points lead to the interpretation that the GC column labeling results from PRV crossing the lateral dendrite DD synapses.
Figure 5
Figure 5
Labeling shows non-stochastic convergence. (A) A mathematical model showing the mean probability of a cell being co-labeled with a known density (percentage) of each species in the ranges relevant to the data. Color scale to the right applies to (A) and (B). Very few co-labeled cells are expected. (B) Column data superimposed on the stochastic model for comparison. Each data point represents a column for which the labeled neurons were counted and the volume measured, a color more red in the spectrum (or lighter blue) than the background represents greater co-labeling than the model predicts. The numbers were divided by the mean expected number of total neurons for the measured volume to obtain percentages. All but six columns show more co-labeling than predicted by chance. While some animals have more co-labeling than others, no trends were statistically significant.
Figure 6
Figure 6
Co-injections vs. separate injection sites. (A) Normalized curve fits showing the deviation of co-labeling from a stochastic model (black line, which represents a single standard deviation from the mean expected co-labeling) for separate injection data (blue line) and co-injection (red line). (B) Cumulative distribution plot of the same data showing the fitted curve (solid lines), the raw data (steps) and statistical significance (light lines). The stochastic curve merges with the top frame of the plot.
Figure 7
Figure 7
Segregated labeling from injections in piriform cortex. Coronal section of the OB 3 days after dual PRV injection into the anterior piriform cortex. Injection sites were separated by 500 microns. Note the sharp divisions between red and green columns. Columns with labeling in both red and green generally show segregation (arrows). (Inset) Horizontal schematic showing the injection sites.
Figure 8
Figure 8
Sections infected in the glomerular layer and prepared as described previously were counter-stained with antibodies to the indicated proteins (A) doublecortin, (B) nestin, (C) glial fibrillary acidic protein, (D) chondroitin sulfate proteoglycan. Arrows indicate co-localization. No sub-population was found that accounts for the observed PRV labeling (see text).

References

    1. Araneda R. C., Kini A. D., Firestein S. (2000). The molecular receptive range of an odorant receptor. Nat. Neurosci. 3, 1248–1255 - PubMed
    1. Arevian A. C., Kapoor V., Urban N. N. (2008). Activity-dependent gating of lateral inhibition in the mouse olfactory bulb. Nat. Neurosci. 11, 80–87 - PMC - PubMed
    1. Banfield B. W., Kaufman J. D., Randall J. A., Pickard G. E. (2003). Development of pseudorabies virus strains expressing red fluorescent proteins: new tools for multisynaptic labeling applications. J. Virol. 77, 10106–10112 - PMC - PubMed
    1. Billig I., Foris J. M., Enquist L. W., Card J. P., Yates B. J. (2000). Definition of neuronal circuitry controlling the activity of phrenic and abdominal motoneurons in the ferret using recombinant strains of pseudorabies virus. J. Neurosci. 20, 7446–7454 - PMC - PubMed
    1. Card J. P., Enquist L. W. (1999). “Transneuronal circuit analysis with pseudorabies virus,” in Current Protocols in Neuroscience, ed. Crawley J. N. (New York, NY: J. Wiley; ), 1.5.1–1.5.28