. 2011 Apr 25:3:1.
doi: 10.3389/fnene.2011.00001. eCollection 2011.

A guide to delineate the logic of neurovascular signaling in the brain

Affiliations

A guide to delineate the logic of neurovascular signaling in the brain

David Kleinfeld et al. Front Neuroenergetics. .

Abstract

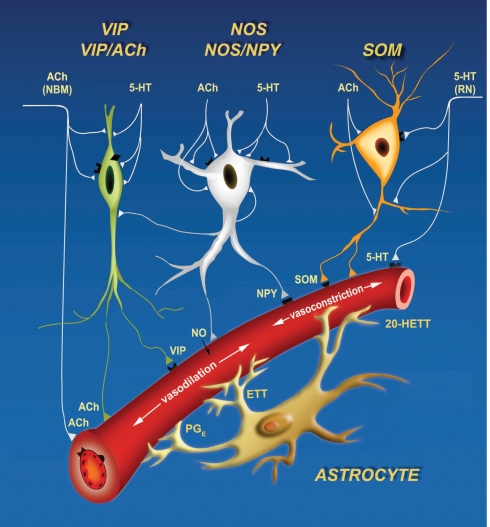
The neurovascular system may be viewed as a distributed nervous system within the brain. It transforms local neuronal activity into a change in the tone of smooth muscle that lines the walls of arterioles and microvessels. We review the current state of neurovascular coupling, with an emphasis on signaling molecules that convey information from neurons to neighboring vessels. At the level of neocortex, this coupling is mediated by: (i) a likely direct interaction with inhibitory neurons, (ii) indirect interaction, via astrocytes, with excitatory neurons, and (iii) fiber tracts from subcortical layers. Substantial evidence shows that control involves competition between signals that promote vasoconstriction versus vasodilation. Consistent with this picture is evidence that, under certain circumstances, increased neuronal activity can lead to vasoconstriction rather than vasodilation. This confounds naïve interpretations of functional brain images. We discuss experimental approaches to detect signaling molecules in vivo with the goal of formulating an empirical basis for the observed logic of neurovascular control.

Keywords: astrocytes; blood flow; channelrhodopsin; interneurons; neurotransmitter; two-photon.


Figures

Figure 1
Figure 1
Three dimensional vectorized reconstruction of all of the cell soma and blood vessels in a slab of mouse cerebral cortex. Features in the raw data are analyzed and transformed into a digital map that represents them as cylinders and spheres with vector coordinates and associated radii. The vascular network is in red, the neuronal nuclei are in green, and non-neuronal nuclei are in yellow. The total volume is a 600-μm × 900-μm × 250-μm. Derived from Tsai et al. (2003, 2009).
Figure 2
Figure 2
Cartoon of three signaling pathways, two local and one global, that can both constrict and dilate the arteriole vasculature. Inhibitory interneurons can drive dilation via nitric oxide (NO), catalyzed by nitric oxide synthetase (NOS), and vasoactive intestinal peptide (VIP), and drive constriction via somatostatin (SOM) and neuropeptide Y (NPY). Astrocytes can dilate via protoglandin E (PGE) and epoxyeicosatrienoic acid (EET) and constrict via 20-Hydroxyeicosatetraenoic acid (20-HETE). Lastly, extrinsic input of acetylcholine (ACh) will dilate while serotonin (5HT) will constrict. Derived from Cauli et al. (2004).
Figure 3
Figure 3
Two-photon laser scanning microscopy with arbitrary scan pathways to record from functionally labeled cells and vessels. (A) Neurons and glia are labeled with the Ca2+ reporter Oregon Green BAPTA-1 AM and glia have sulforhodamine 101 as an additional label. Blood plasma is stained with fluorescein so that blood cell motion is measured. (B) Intensity along the scan path records Ca2+ signals and blood cell movement. (C) Traces of functional changes in intracellular Ca2+ and flood flow; note flow changes concurrent with stimulation. Algorithms from Helmchen and Kleinfeld (2008), Drew et al. (2010), Driscoll et al. (2011).
Figure 4
Figure 4
Overview of CNiFER methodology. (A) Schematic of the cell-based sensors with a Gq family, G-protein coupled receptor for acetylcholine and the TN-XXL genetically expressible calcium reporter. (B). Cartoon of the injection of CNiFERs and the placement of microelectrodes in rat frontal cortex. (C) In vivo response of M1-CNiFERs to cholinergic input after electrical activation of nucleus basalis (NBM). The X–Z scan was obtained with TPLSM through the depth of cortex before and after activation of cholinergic neurons in NBM. (D) Time dependence of the M1-CNiFER response, together with control data from CNiFERs without the M1 receptor, and the electrocorticogram (ECoG). The decrease in amplitude of the ECoG after stimulation, as expected for cholinergic activation of cortex. Adapted from Nguyen et al. (2010).
Figure 5
Figure 5
In vivo measurements of arteriole smooth muscle activation concomitant with changes in blood flow in a neighboring microvessel. We made use of α-actin-BAC-GCaMP2 mice that expressed the genetically encoded Ca2+ indicator GCaMP2 in smooth muscle (Ji et al., 2004). Two-photon laser scanning microscopy was used to measure both calcium concentration and blood flow. The change in vessel diameter in the bottom line-scan data is a vasomotor event. In these transgenic animals the observable changes in [Ca2+] are limited to large contractile events; thus the present data must be considered as preliminary. Algorithms from Helmchen and Kleinfeld (2008).
Figure 6
Figure 6
In vivo focal photoexcitation of channelrhodopsin-labeled astrocytes leads an increase in capillary blood flow. We used GFAP-Cre+/− mice with an injection of adeno-associated virus serotype 2/5 with a FLEX-ChR2-tdtomato construct (Zhuo et al., 2001). Histological analysis shows that these animals have weak, non-specific expression of Cre recombinase in cortical neurons during adulthood, when the viral injection was made; thus the present data must be considered as preliminary. (A) Schematic of measurement region. (B) Planar image from layer 2/3, obtained with TPLSM, that includes a scanned capillary. (C) Change in capillary red blood cell speed upon activation of ChR2; the black line is a running average to remove heart rate contributions.
Figure 7
Figure 7
Ipsilateral versus contralateral electrophysiological and neurovascular responses to sensory input. (A) Schematic of neuronal pathways. The contralateral cortex receives input via brainstem (not shown) and thalamic relays. This input is further relayed to ipsilateral cortex via collosal projections. (B) Measured multiunit responses to electrical stimulation of the fore-limb; 500 stimulation trials were averaged. (C). Net vasodilation in surface cortical arterioles in response to somatotopic stimulation on the contralateral side (upper traces in each pair) but vasoconstriction in response to ipsilateral stimulation (lower traces). The stimulus-induced ECoG (red) identifies the locus of the electrical response. Adapted from Devor et al. (2008).
Figure 8
Figure 8
Proposal for observing opposing vascular changes via competition of vasoactive neuropeptides. This proposal builds on the results in Figure 6, where the same sensory input leads to vasodilation at the epicenter of cortical activation in the contralateral hemisphere by vasoconstriction in the ipsilateral hemisphere. We predict that co-release of the dilator VIP dominates In the contralateral hemisphere while the constrictor SOM dominates in the ipsilateral hemisphere.

References

    1. Airan R. D., Thompson K. R., Fenno L. E., Bernstein H., Deisseroth K. (2009). Temporally precise in vivo control of intracellular signalling. Nat. Methods 458, 1025–102910.1002/1098-1136(20010101)33:1<72::AID-GLIA1007>3.0.CO;2-A - DOI - PubMed
    1. Alexander G. M., Rogan S. C., Abbas A. I., Armbruster B. N., Pei Y., Allen J. A., Nonneman R. J., Hartmann J., Moy S. S., Nicolelis M. A., McNamara J. O., Roth B. L. (2009). Remote control of neuronal activity in transgenic mice expressing evolved G protein-coupled receptors. Neuron 63, 27–3910.1016/j.neuron.2009.06.014 - DOI - PMC - PubMed
    1. Arenkiel B. R., Klein M. E., Davison I. G., Katz L. C., Ehlers M. D. (2008). Genetic control of neuronal activity in mice conditionally expressing TRPV1. Nat. Methods 5, 299–302 - PMC - PubMed
    1. Arenkiel B. R., Peca J., Davison I. G., Feliciano C., Deisseroth K., Augustine G. J., Ehlers M. D., Feng G. (2007). In vivo light-induced activation of neural circuitry in transgenic mice expressing channelrhodopsin-2. Neuron 54, 205–21810.1016/j.neuron.2007.03.005 - DOI - PMC - PubMed
    1. Atasoy D., Aponte Y., Su H. H., Sternson S. M. (2008). A FLEX switch targets channelrhodopsin-2 to multiple cell types for imaging and long-range circuit mapping. J. Neurosci. 28, 7025–703010.1523/JNEUROSCI.1954-08.2008 - DOI - PMC - PubMed

LinkOut - more resources