. 2011 Apr 5;2(5):1106-14.
doi: 10.1364/BOE.2.001106.

Method for deriving visual field boundaries from OCT scans of patients with retinitis pigmentosa

Method for deriving visual field boundaries from OCT scans of patients with retinitis pigmentosa

Donald C Hood et al. Biomed Opt Express. .

Abstract

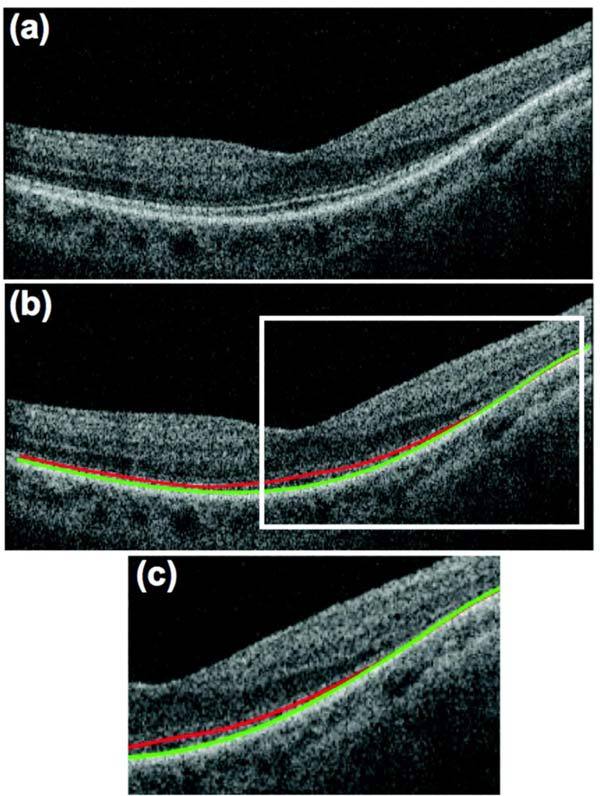
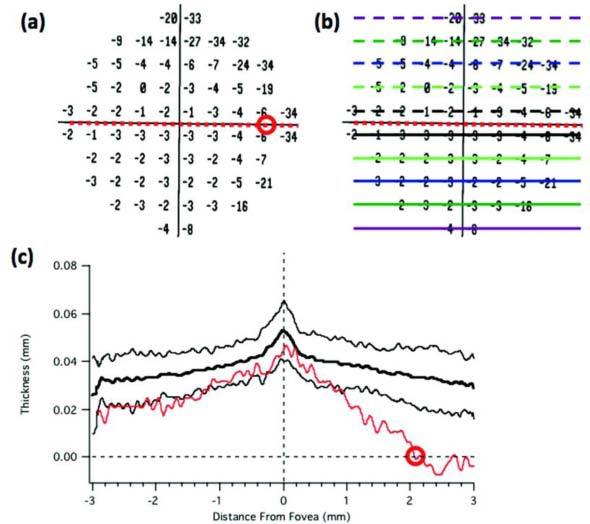
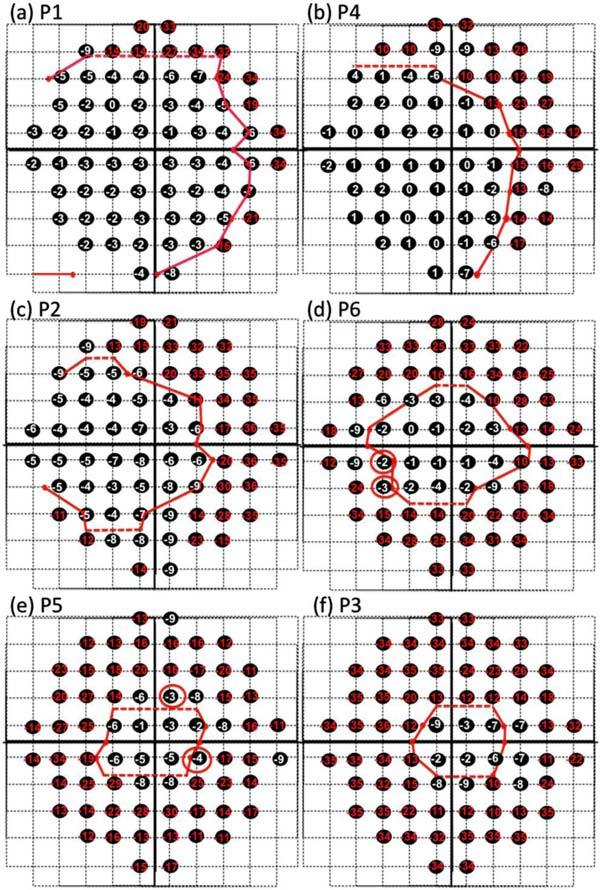
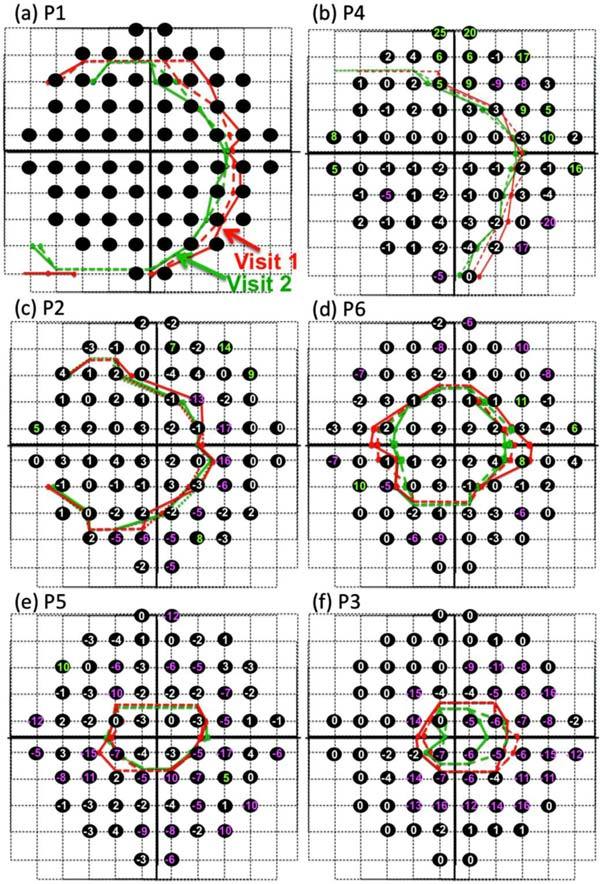
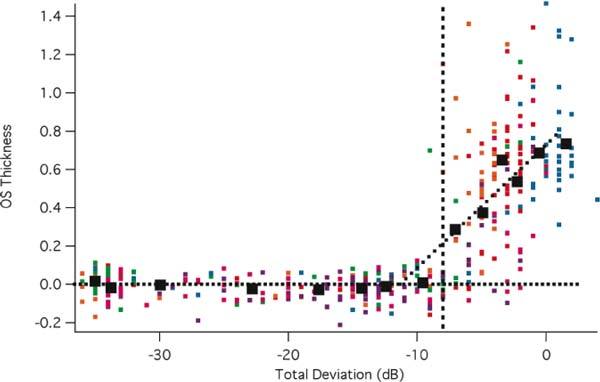
The location of the loss of the inner segment (IS)/outer segment (OS) border, as seen with frequency domain optical coherence tomography (fdOCT), was determined on fdOCT scans from patients with retinitis pigmentosa. A comparison to visual field loss supported the hypothesis, based upon previous work, that the point at which the IS/OS border disappears provides a structural marker for the edge of the visual field. Repeat fdOCT measures showed good within day reproducibility, while data obtained on average 22.5 months later showed signs of progression. The IS/OS contour shows promise as a measure for following changes in patients undergoing treatment.

Keywords: (170.4500) Optical coherence tomography; (330.4300) Vision system - noninvasive assessment.


Figures

Fig. 1
Fig. 1
fdOCT scan through the horizontal meridian of P1. (a) Scan before segmentation. (b) Scan after segmentation of IS/OS (red) and OS/RPE (green) boundaries. (c) Expanded view of portion within white rectangle in panel (b).
Fig. 2
Fig. 2
An illustration of the procedure for estimating the end of the IS/OS border using the horizontal scan for P1 shown in Fig. 1. (a) The 10-2 total deviation plot. (b) Same as panel A with the location of the scans segmented. (c) The thickness of the OS layer as a function of distance across the scan shown in Fig. 1. The dashed lines indicate zero OS thickness (horizontal) and the center of the fovea (vertical).
Fig. 3
Fig. 3
IS/OS contours and visual fields. A dashed line was used where the exact location of the IS/OS disappearance was uncertain due to the sparse vertical spacing of the segmented scans. (a) The 10-2 visual field losses (total deviation in dB) are shown with the boundary (red curve) of the IS/OS loss for patient P1. Visual field losses of −10 or worse are shown in red. (b)-(f). Same as in (a) for the other 5 patients.
Fig. 4
Fig. 4
Repeat measures within and across sessions. In each panel, the red and green curves show the 2 scans performed on the first (red) and second (green) visits. Black circles indicate the location of the 10-2 points and the numbers (in dB) show the change in field sensitivity (in dB) between the 2 visits (visit 2-visit 1).
Fig. 5
Fig. 5
OS thickness versus field loss. The thickness of the OS at each point in the visual field is shown for individual patients (small symbols) as a function of the field loss at that point. The large symbols are the means of the data grouped into equal sized bins.

References

    1. Apushkin M. A., Fishman G. A., Alexander K. R., Shahidi M., “Retinal thickness and visual thresholds measured in patients with retinitis pigmentosa,” Retina 27(3), 349–357 (2007).10.1097/01.iae.0000224944.33863.18 - DOI - PubMed
    1. Aleman T. S., Cideciyan A. V., Sumaroka A., Windsor E. A., Herrera W., White D. A., Kaushal S., Naidu A., Roman A. J., Schwartz S. B., Stone E. M., Jacobson S. G., “Retinal laminar architecture in human retinitis pigmentosa caused by Rhodopsin gene mutations,” Invest. Ophthalmol. Vis. Sci. 49(4), 1580–1590 (2008).10.1167/iovs.07-1110 - DOI - PMC - PubMed
    1. Jacobson S. G., Aleman T. S., Sumaroka A., Cideciyan A. V., Roman A. J., Windsor E. A., Schwartz S. B., Rehm H. L., Kimberling W. J., “Disease boundaries in the retina of patients with Usher syndrome caused by MYO7A gene mutations,” Invest. Ophthalmol. Vis. Sci. 50(4), 1886–1894 (2009).10.1167/iovs.08-3122 - DOI - PubMed
    1. Jacobson S. G., Cideciyan A. V., Aleman T. S., Sumaroka A., Windsor E. A., Schwartz S. B., Heon E., Stone E. M., “Photoreceptor layer topography in children with leber congenital amaurosis caused by RPE65 mutations,” Invest. Ophthalmol. Vis. Sci. 49(10), 4573–4577 (2008).10.1167/iovs.08-2121 - DOI - PMC - PubMed
    1. Rangaswamy N. V., Patel H. M., Locke K. G., Hood D. C., Birch D. G., “A comparison of visual field sensitivity to photoreceptor thickness in retinitis pigmentosa,” Invest. Ophthalmol. Vis. Sci. 51(8), 4213–4219 (2010).10.1167/iovs.09-4945 - DOI - PMC - PubMed

LinkOut - more resources