

Optical delineation of human malignant melanoma using second harmonic imaging of collagen
- PMID: 21559140
- PMCID: PMC3087585
- DOI: 10.1364/BOE.2.001282
Optical delineation of human malignant melanoma using second harmonic imaging of collagen
Abstract
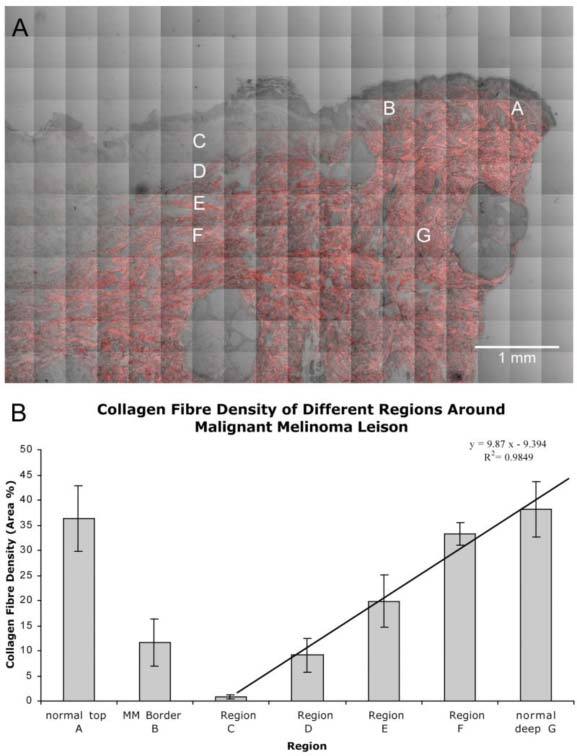
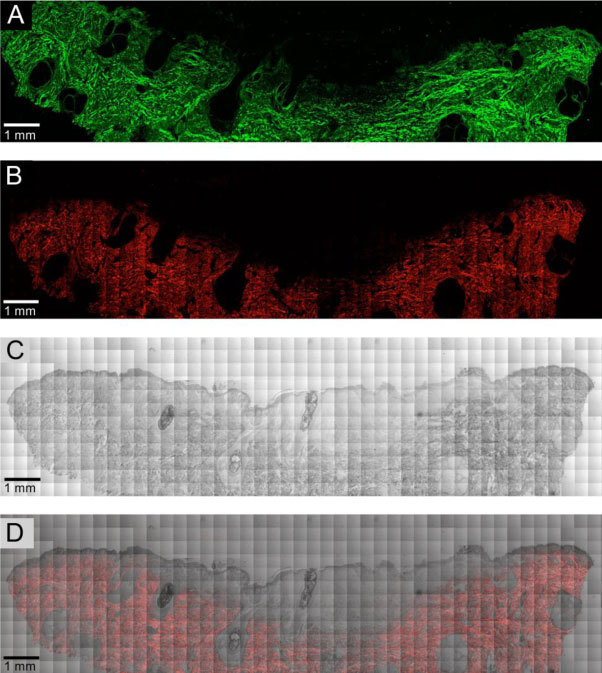
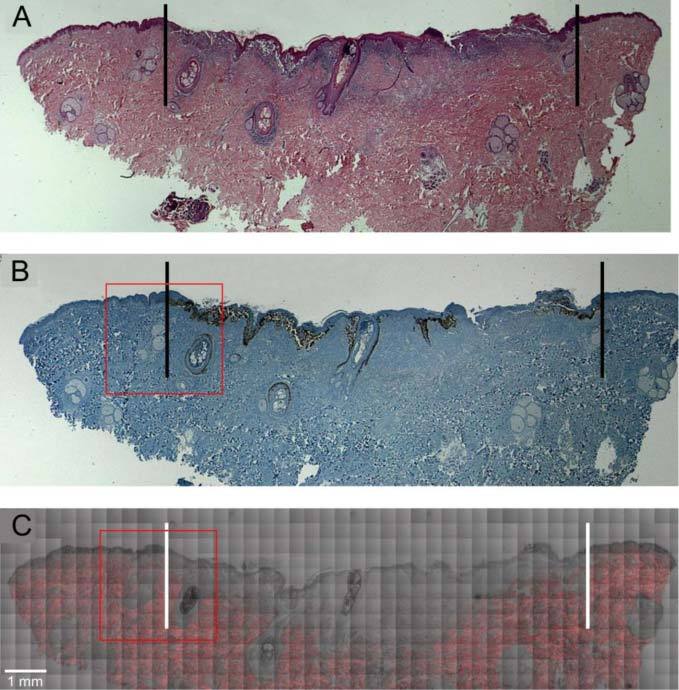
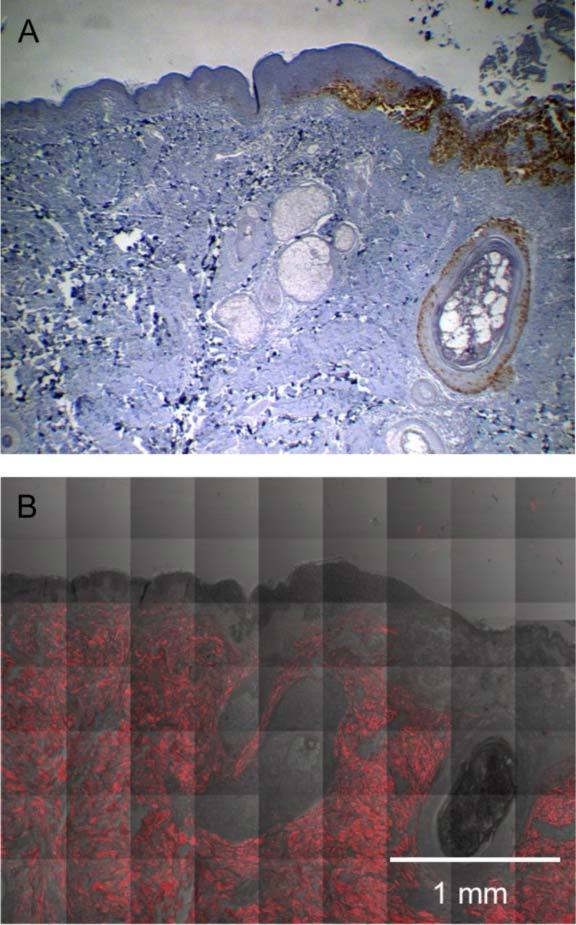
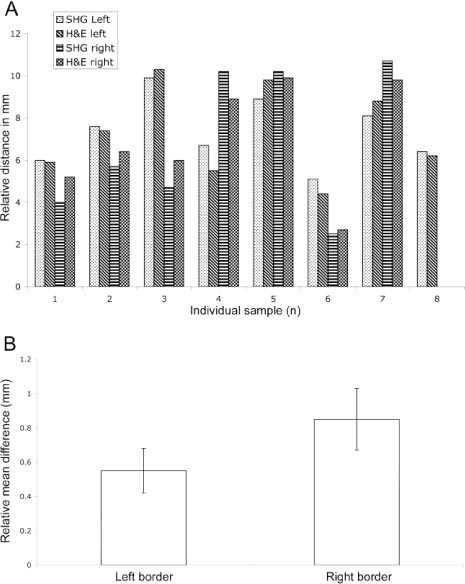
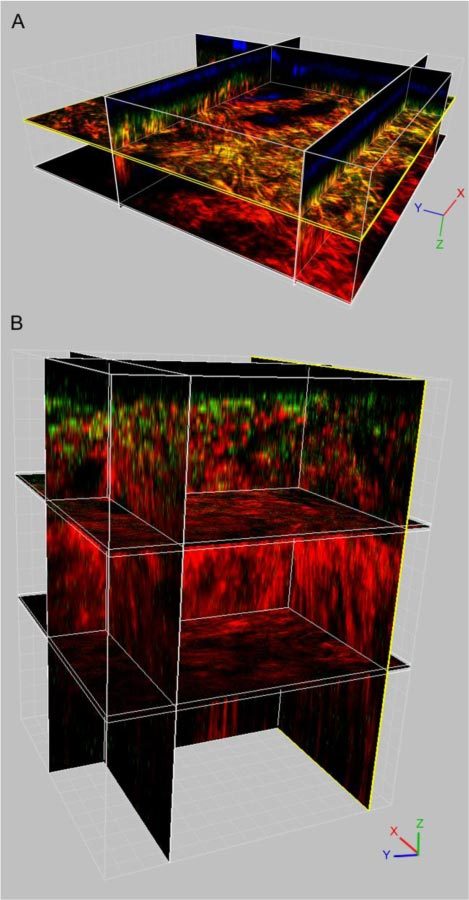
Skin cancer incidence has increased exponentially over the last three decades. In 2008 skin cancer caused 2280 deaths in the UK, with 2067 due to malignant melanoma. Early diagnosis can prevent mortality, however, conventional treatment requires multiple procedures and increasing treatment times. Second harmonic generation (SHG) imaging could offer diagnosis and demarcation of melanoma borders non-invasively at presentation thereby short-cutting the excision biopsy stage. To test the efficacy and accuracy of SHG imaging of collagen in skin and to delineate the borders of skin cancers, unstained human melanoma biopsy sections were imaged using SHG microscopy. Comparisons with sister sections, stained with H&E or Melan-A were made for correlation of invasion borders. Fresh ex vivo normal human and rat skin was imaged through its whole thickness using SHG to demonstrate this technique is transferable to in vivo tissues. SHG imaging demonstrated detailed collagen distribution in normal skin, with total absence of SHG signal (fibrillar collagen) within the melanoma-invaded tissue. The presence or absence of signal changes dramatically at the borders of the melanoma, accurately demarcating the edges that strongly correlated with H&E and Melan-A defined borders (p<0.002). SHG imaging of ex vivo human and rat skin demonstrated collagen architecture could be imaged through the full thickness of the skin. We propose that SHG imaging could be used for diagnosis and accurate demarcation of melanoma borders on presentation and therefore potentially reduce mortality rates.
Keywords: (170.3880) Medical and biological imaging; (180.1790) Confocal microscopy; (180.4315) Nonlinear microscopy; (190.1900) Diagnostic applications of nonlinear optics.
Figures
Similar articles
-
Role of In Vivo Reflectance Confocal Microscopy in the Analysis of Melanocytic Lesions.Acta Dermatovenerol Croat. 2018 Apr;26(1):64-67. Acta Dermatovenerol Croat. 2018. PMID: 29782304 Review.
-
Correlation between polarization sensitive optical coherence tomography and second harmonic generation microscopy in skin.Biomed Opt Express. 2015 Jun 16;6(7):2542-51. doi: 10.1364/BOE.6.002542. eCollection 2015 Jul 1. Biomed Opt Express. 2015. PMID: 26203380 Free PMC article.
-
Hyperglycemia-induced abnormalities in rat and human corneas: the potential of second harmonic generation microscopy.PLoS One. 2012;7(11):e48388. doi: 10.1371/journal.pone.0048388. Epub 2012 Nov 5. PLoS One. 2012. PMID: 23139780 Free PMC article.
-
Stromal alterations in ovarian cancers via wavelength dependent Second Harmonic Generation microscopy and optical scattering.BMC Cancer. 2017 Feb 6;17(1):102. doi: 10.1186/s12885-017-3090-2. BMC Cancer. 2017. PMID: 28166758 Free PMC article.
-
Second-harmonic generation imaging of cancer.Methods Cell Biol. 2014;123:531-46. doi: 10.1016/B978-0-12-420138-5.00028-8. Methods Cell Biol. 2014. PMID: 24974046 Review.
Cited by
-
Detection and Discrimination of Non-Melanoma Skin Cancer by Multimodal Imaging.Healthcare (Basel). 2013 Oct 17;1(1):64-83. doi: 10.3390/healthcare1010064. Healthcare (Basel). 2013. PMID: 27429131 Free PMC article.
-
Taking a deep look: modern microscopy technologies to optimize the design and functionality of biocompatible scaffolds for tissue engineering in regenerative medicine.J R Soc Interface. 2013 Jul 17;10(86):20130263. doi: 10.1098/rsif.2013.0263. Print 2013 Sep 6. J R Soc Interface. 2013. PMID: 23864499 Free PMC article. Review.
-
Discrimination of normal and cancerous human skin tissues based on laser-induced spectral shift fluorescence microscopy.Sci Rep. 2022 Dec 3;12(1):20927. doi: 10.1038/s41598-022-25055-y. Sci Rep. 2022. PMID: 36463297 Free PMC article.
-
Photo-induced processes in collagen-hypericin system revealed by fluorescence spectroscopy and multiphoton microscopy.Biomed Opt Express. 2014 Apr 2;5(5):1355-62. doi: 10.1364/BOE.5.001355. eCollection 2014 May 1. Biomed Opt Express. 2014. PMID: 24877000 Free PMC article.
-
Multimodal imaging platform for optical virtual skin biopsy enabled by a fiber-based two-color ultrafast laser source.Biomed Opt Express. 2019 Jan 10;10(2):514-525. doi: 10.1364/BOE.10.000514. eCollection 2019 Feb 1. Biomed Opt Express. 2019. PMID: 30800496 Free PMC article.
References
-
- Cancer Research UK, “Statistical Information Team” (2010), http://info.cancerresearchuk.org/cancerstats/types/skin/incidence/
-
- ISD-Online, “Cancer incidence and mortality data” (2010), www.isdscotland.org/isd/183.html
-
- Northern Ireland Cancer Registry, “Cancer incidence and mortality” (2008), www.qub.ac.uk/research-centres/nicr/Data/OnlineStatistics/MalignantMelan...
-
- Office for National Statistics, “Registrations of cancer diagnosed in 2005, England” (2008), www.statistics.gov.uk/statbase/Product.asp?vlnk=8843&More=N
-
- Welsh Cancer Intelligence and Surveillance Unit, “Cancer incidence in Wales, 2003-2007” (2010), www.wales.nhs.uk/sites3/page.cfm?orgid=242&pid=35385
LinkOut - more resources
Full Text Sources