. 2011 Apr 29;2(5):1377-93.
doi: 10.1364/BOE.2.001377.

Simultaneous multiple-emitter fitting for single molecule super-resolution imaging

Simultaneous multiple-emitter fitting for single molecule super-resolution imaging

Fang Huang et al. Biomed Opt Express. .

Abstract

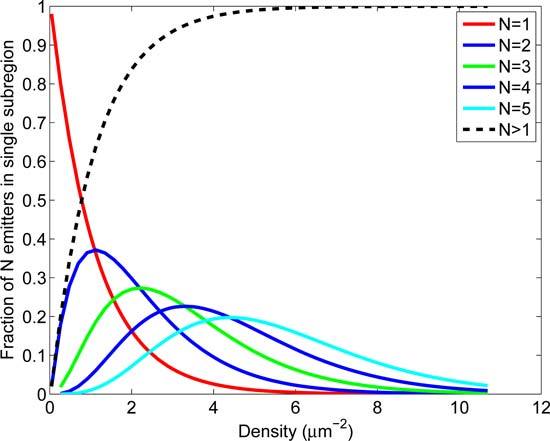
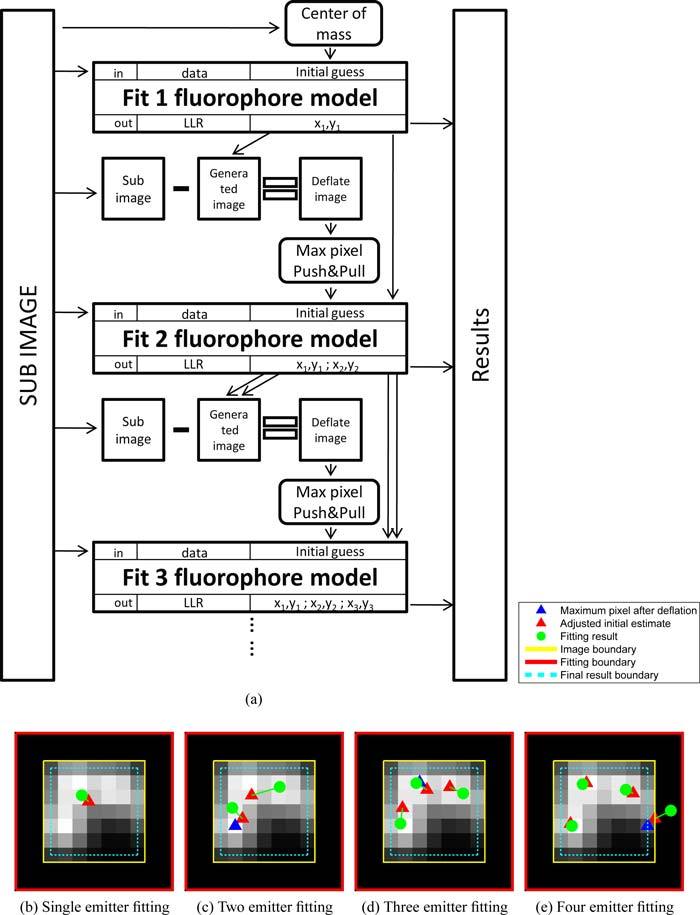
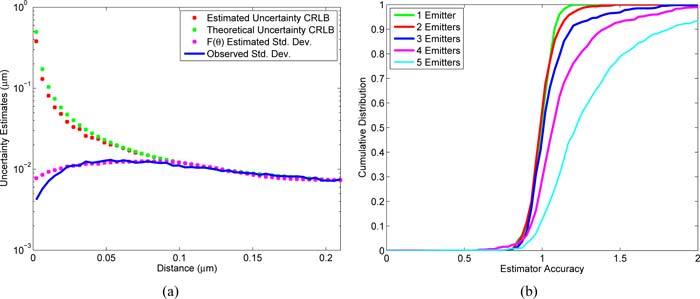
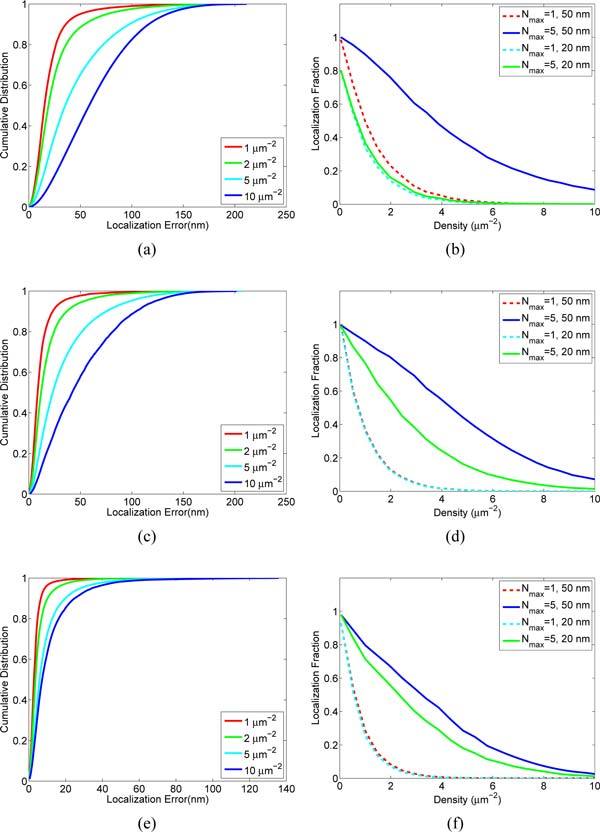
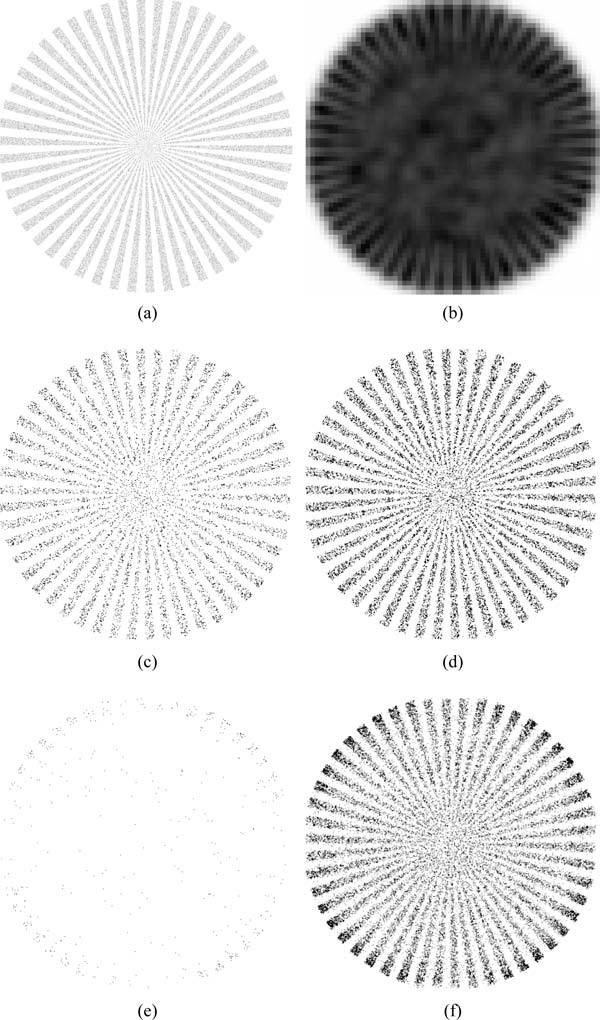
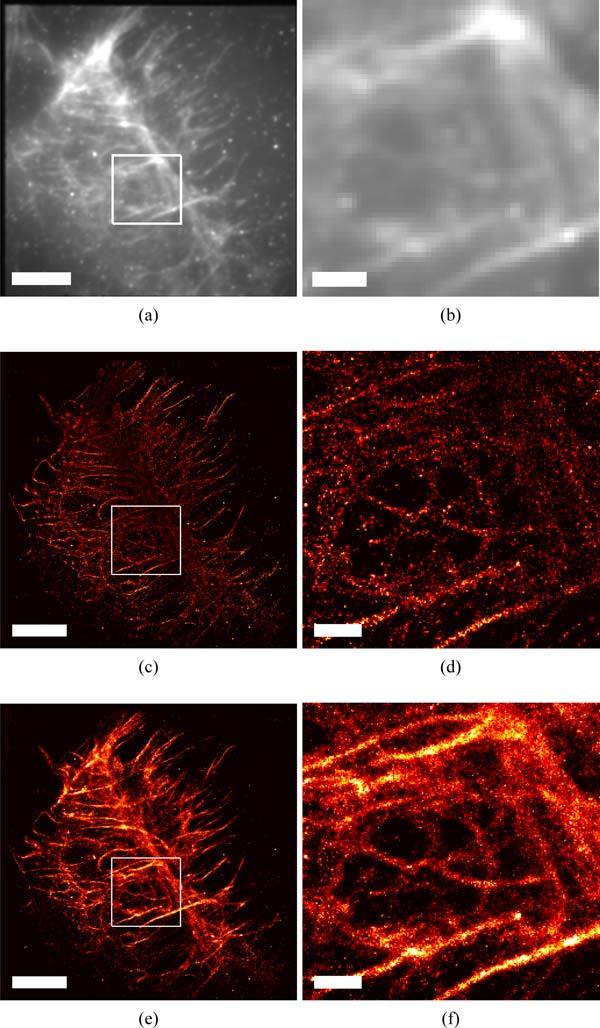
Single molecule localization based super-resolution imaging techniques require repeated localization of many single emitters. We describe a method that uses the maximum likelihood estimator to localize multiple emitters simultaneously within a single, two-dimensional fitting sub-region, yielding an order of magnitude improvement in the tolerance of the analysis routine with regards to the single-frame active emitter density. Multiple-emitter fitting enables the overall performance of single-molecule super-resolution to be improved in one or more of several metrics that result in higher single-frame density of localized active emitters. For speed, the algorithm is implemented on Graphics Processing Unit (GPU) architecture, resulting in analysis times on the order of minutes. We show the performance of multiple emitter fitting as a function of the single-frame active emitter density. We describe the details of the algorithm that allow robust fitting, the details of the GPU implementation, and the other imaging processing steps required for the analysis of data sets.

Keywords: (100.3010) Image reconstruction techniques; (100.6640) Superresolution; (180.2520) Fluorescence microscopy.


Figures

Fig. 1
Fig. 1
Proximity of emitters as a function of emitter density. The probabilities of finding N=1–5 emitters within a 8σPSF×8σPSF square sub-region (σPSF = 127 nm) at different densities were calculated for a uniformly distributed population of emitters and plotted as a function of density. As the emitter density increases beyond 1 μm−2, the fraction of subregions containing single emitters reduces dramatically (red line), emphasizing the need for fitting algorithms that can accommodate multiple emitters within a single sub-region.
Fig. 2
Fig. 2
Illustration of execution steps in the multi-emitter estimation task. (a) Fitting algorithm flowchart. For a given sub-region, MFA is performed sequentially from the N = 1 emitter model to either the Nmax emitter model or is terminated if the maximum pixel counts in the residuum image is lower than 10 counts. (b) through (e): Demonstration of the results from each estimation task from the 1 emitter model through the 4 emitter model. The 5 emitter model fitting is not performed by the algorithm, because of the low photon counts in the deflated image.
Fig. 3
Fig. 3
Single fluorophore intensity distribution of the organic fluorophore Alexa Fluor 647 obtained from the data set described in section 4.4.1 taken in TIRF condition. The distribution is modeled as a normal distribution with μ = 800, σ = 100.
Fig. 4
Fig. 4
Performance of the precision estimate. (a) A comparison between the precision predicted from the CRLB and from the modified Fisher information matrix. A series of simulated images of two emitters at varoius separations between their centers were generated. MFA was performed on these images and the precision estimates calculated by the modified Fisher information matrices (F(θ) Estimated Std. Dev.) were compared with that obtained from the CRLB (Estimated Uncertainty CRLB), precisions obtained from the CRLB generated by emitter’s true position (Theoretical Uncertainty CRLB), and the observed standard deviation of the estimates (Observed Std. Dev.). (b) The CDF (integral of histogram) of the uncertainty estimator accuracy obtained using the modified Fisher information matrices for random placements of multiple emitters.
Fig. 5
Fig. 5
Performance versus active emitter density and intensity distribution. Shown are the results of MFA analysis of images with spatially random distributed emitters with normally distributed intensities of 300 ± 30 (a), (b), 800 ± 100 (c), (d), and 5000 ± 30 (e), (f). Localization error is calculated as the distance from the estimated position to the found position and in all cases assumes Nmax = 5. The median localization error is where the cumulative distribution reaches 0.5. Localization fraction is the fraction of emitters that are correctly localized as determined by being found within either 20 nm or 50 nm from the known position.
Fig. 6
Fig. 6
(a) The emitter position histogram used in generating synthetic data. (b) Sum projection of the generated image. (c) Single emitter fitting result at a density of 1 μm−2 with Nmax = 1. (d) Multiple emitter fitting result at a density of 1 μm−2 with Nmax = 5. (e) Single emitter fitting result at a density of 6 μm−2 with Nmax = 1. (f) Multiple emitter fitting result at a density of 6 μm−2 with Nmax = 5. At 1 μm−2 case, Nmax = 1 resulted in 12848 emitters localized while Nmax = 5 localized 30354 emitters. While in 6 μm−2 case, Nmax = 1 resulted in 519 emitters localized while Nmax = 5 localized 33580 emitters. The contrast of images (c) to (f) were globally adjusted across all images for optimal display.
Fig. 7
Fig. 7
Comparison of SM-SR fitting routines for imaging the actin mesh-work within a HeLa cell labeled with Alexa 647 phalloidin. Conventional TIRF microscopy, (a) and (b), compared with SM-SR images generated using both a Nmax = 1, (c) and (d), and Nmax = 5, (e) and (f). Actin rich regions, seen in top right of (b),(d),(f) are missing using single emitter routines (Nmax = 1) (d), but successfully fit using the MFA (Nmax = 5) (f). The increase in molecular density found using the MFA (Nmax = 5) routine also reveals a more complete depiction of the underlying actin structure, outlining possible actin corrals seen in the center of (f). Scales bars represent 5 μm in (a), (c), (e) and 1 μm in (b), (d), (f).

References

    1. Hell S. W., “Far-field optical nanoscopy,” Science 316, 1153–1158 (2007).10.1126/science.1137395 - DOI - PubMed
    1. Chi K. R., “Microscopy: ever-increasing resolution,” Nature 462, 675–678 (2009).10.1038/462675a - DOI - PubMed
    1. Huang B., Bates M., Zhuang X. W., “Super-resolution fluorescence microscopy,” Annu. Rev. Biochem. 78, 993–1016 (2009).10.1146/annurev.biochem.77.061906.092014 - DOI - PMC - PubMed
    1. Patterson G., Davidson M., Manley S., Lippincott-Schwartz J., “Superresolution imaging using single-molecule localization,” Annu. Rev. Phys. Chem. 61, 345–367 (2010).10.1146/annurev.physchem.012809.103444 - DOI - PMC - PubMed
    1. Schermelleh L., Heintzmann R., Leonhardt H., “A guide to super-resolution fluorescence microscopy,” J. Cell Biol. 190, 165–175 (2010).10.1083/jcb.201002018 - DOI - PMC - PubMed

LinkOut - more resources